AE Adult Echocardiography Examination Questions and Answers
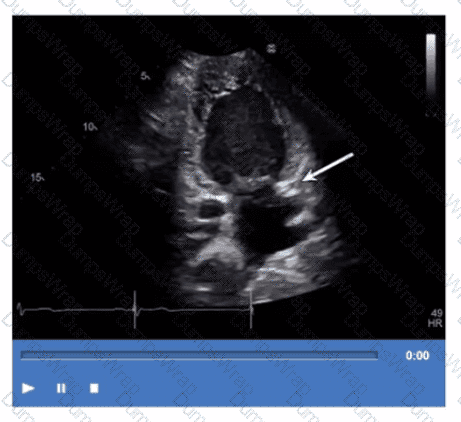
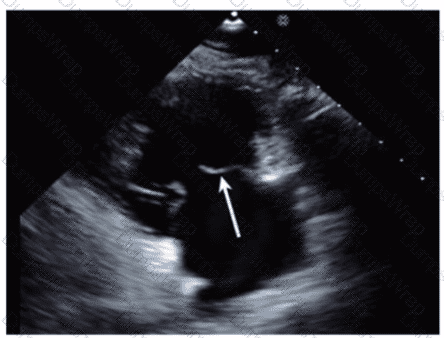
Which structure is the arrow pointing to in this video?
Options:
Left lower pulmonary vein
Descending aorta
Coronary sinus
Left atrial appendage
Answer:
CExplanation:
The arrow points to the coronary sinus, which is a venous structure located posteriorly in the atrioventricular groove, emptying into the right atrium. It appears as a circular anechoic structure near the left atrium in echocardiographic images.
Left lower pulmonary vein enters the left atrium more superiorly. Descending aorta is posterior to the heart but not in this location. Left atrial appendage is an anterior finger-like projection of the left atrium, separate from the coronary sinus.
This anatomy is described in the "Textbook of Clinical Echocardiography, 6e", Chapter on Cardiac Venous Anatomy【20:140-145†Textbook of Clinical Echocardiography】.
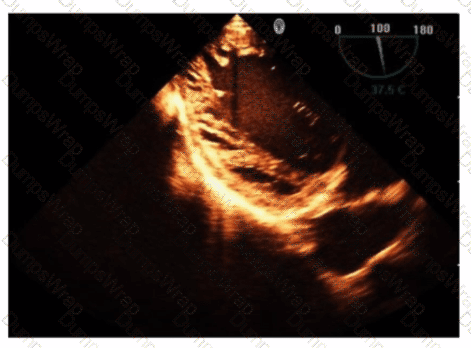
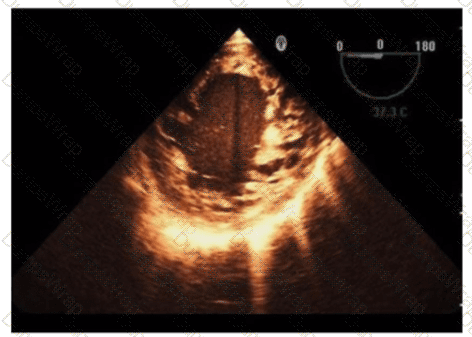
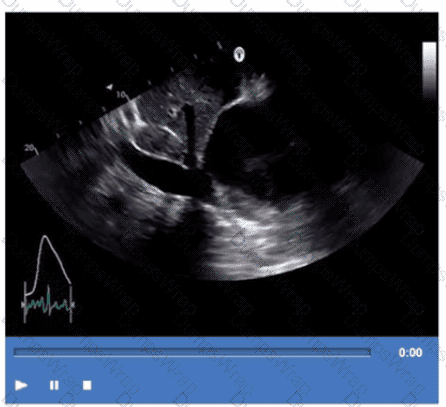
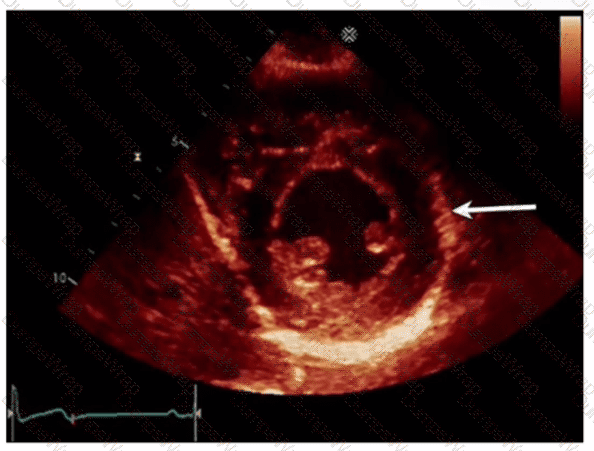
Which is the most likely abnormality represented in these images from a 48-year-old man with shortness of breath?
Options:
Loeffler syndrome
Hypertrophic cardiomyopathy
Left ventricular noncompaction
Ischemic cardiomyopathy
Answer:
CExplanation:
The echocardiographic images show prominent trabeculations and deep intertrabecular recesses communicating with the left ventricular cavity, best seen on contrast-enhanced images. This finding is characteristic of left ventricular noncompaction (LVNC), a cardiomyopathy resulting from arrested myocardial compaction during embryogenesis.
LVNC is diagnosed by visualizing a two-layered myocardium with a thin compacted epicardial layer and a thicker noncompacted endocardial layer with deep trabecular recesses. The use of contrast echocardiography enhances endocardial border delineation and recess visualization, increasing diagnostic accuracy.
Loeffler syndrome (hypereosinophilic cardiomyopathy) often shows endomyocardial fibrosis and restrictive physiology but not prominent trabeculations. Hypertrophic cardiomyopathy shows asymmetric septal hypertrophy without deep recesses. Ischemic cardiomyopathy shows wall motion abnormalities but not characteristic trabecular patterns.
These diagnostic criteria and imaging features are well documented in the "Textbook of Clinical Echocardiography" and ASE guidelines on cardiomyopathies and use of contrast echo【16:Textbook of Clinical Echocardiography, 6e†Chapter on LV Noncompaction】【12:ASE Contrast Echocardiography Guidelines†p.180-190】.
Which view best demonstrates a wall thickening abnormality of the apical lateral segment?
Options:
Two-chamber
Four-chamber
Parasternal long axis
Mid-parastemal short axis
Answer:
AExplanation:
The two-chamber apical view allows visualization of the left ventricle's anterior and inferior walls, including the apical lateral segment. It is ideal for assessing wall thickness and segmental wall motion abnormalities in this region.
The four-chamber view visualizes septal and lateral walls but does not optimally display the apical lateral segment. Parasternal long axis primarily visualizes the anterior septum and posterior wall but is limited for lateral apex. The mid-parasternal short axis focuses on mid-ventricular segments and does not visualize the apex.
This anatomical and echocardiographic detail is described in the "Textbook of Clinical Echocardiography, 6e", Chapter on Left Ventricular Segmental Analysis【20:120-125†Textbook of Clinical Echocardiography】.
What is the normal dP/dt value of left ventricular systolic function?
Options:
400-799 mmHg/s
800-1199 mmHg/s
Less than 400 mmHg/s
Greater than 1200 mmHg/s
Answer:
DExplanation:
Comprehensive and Detailed Explanation From Exact Extract:
The left ventricular dP/dt is a measure of the rate of rise in left ventricular pressure during isovolumic contraction, which reflects systolic function. It is derived from Doppler echocardiography by measuring the time interval between mitral regurgitant jet velocities of 1 m/s and 3 m/s. Using the simplified Bernoulli equation, the pressure gradient at each velocity is calculated, and the rate of pressure rise (dP/dt) is calculated by dividing the pressure difference by the time interval between these velocities.
A normal left ventricular dP/dt is generally considered to be greater than 1200 mmHg/s. Values lower than this indicate impaired systolic function, as the ventricle is slower to generate pressure during contraction.
For example, a measured time interval of 36 milliseconds (0.036 seconds) between the MR velocities of 1 and 3 m/s corresponds to a dP/dt of approximately 889 mmHg/s, which is mildly reduced, indicating some systolic dysfunction.
The exact extract from the "Textbook of Clinical Echocardiography, 6e" states that normal dP/dt values are typically above 1000 mmHg/s, with >1200 mmHg/s considered a robust indicator of normal systolic function. This measure is useful but requires a measurable mitral regurgitation jet and consistent alignment of the ultrasound beam. Variability in measurement can occur based on technical factors, but the dP/dt remains a useful parameter to quantify systolic function noninvasively.
Which parameter is necessary to calculate a 2D left atrial volume index?
Options:
Age
Height
Blood pressure
Cardiac output
Answer:
BExplanation:
Comprehensive and Detailed Explanation From Exact Extract:
The left atrial volume index (LAVI) is the left atrial volume normalized to the patient's body surface area (BSA), which accounts for patient size. To calculate BSA, height and weight are required, most commonly using formulas such as the Mosteller formula.
Therefore, height is a necessary parameter to calculate the left atrial volume index. Age, blood pressure, and cardiac output are not used in the calculation of LAVI but may be clinically relevant for interpretation.
This approach standardizes LA size across patients of different body habitus, making LAVI a more accurate and reproducible measure of LA remodeling and a predictor of cardiovascular outcomes.
The echocardiography guidelines and textbooks emphasize the importance of indexing LA volume to BSA and highlight height as a required measurement for this purpose .
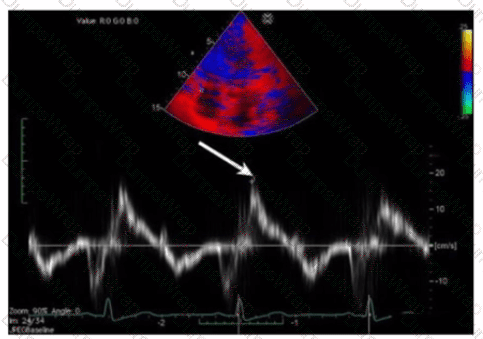
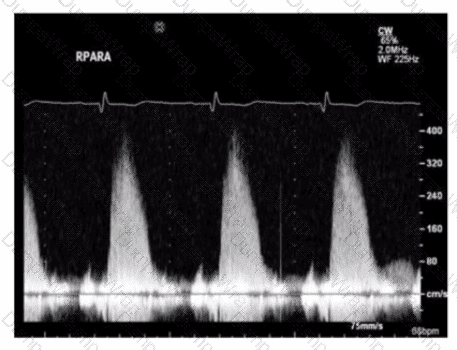
The sonographer obtains this Doppler signal while using the non-imaging transducer in the apical position. What is the best way to differentiate between mitral regurgitation and aortic stenosis signals in the waveform shown in this image?

Options:
Aortic stenosis velocities will always be higher
Aortic stenosis waveforms will always be denser
Mitral regurgitation only happens in diastole
Mitral regurgitation signal will be longer
Answer:
DExplanation:
Comprehensive and Detailed Explanation From Exact Extract:
Mitral regurgitation (MR) Doppler signals tend to be longer in duration because MR occurs throughout systole, often spanning most or all of ventricular systole, resulting in a prolonged jet on continuous wave Doppler.
Aortic stenosis (AS) velocities can be high but may vary and are not necessarily always higher than MR velocities. The density of waveforms is not a reliable discriminator. MR only happens in systole, not diastole, which makes option C incorrect.
Therefore, the duration or length of the Doppler signal (longer for MR) is the best differentiating feature.
This differentiation is explained in the "Textbook of Clinical Echocardiography, 6e", Chapter on Doppler Assessment of Valvular Disease【20:320-325†Textbook of Clinical Echocardiography】.
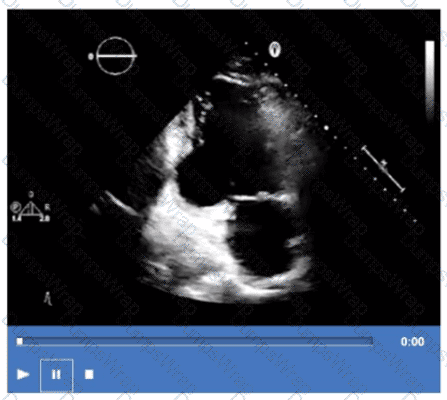
Which pathology is demonstrated in this video clip?
Options:
Amyloidosis
Sarcoidosis
Apical hypertrophic cardiomyopathy
Isolated left ventricular noncompaction
Answer:
DExplanation:
The video shows prominent trabeculations with deep intertrabecular recesses communicating with the left ventricular cavity, characteristic of isolated left ventricular noncompaction (LVNC). This congenital cardiomyopathy features a spongy myocardial appearance with thickened noncompacted layers.
Amyloidosis typically presents with thickened, bright myocardium but without prominent trabeculations. Sarcoidosis involves granulomatous inflammation, and apical hypertrophic cardiomyopathy shows localized hypertrophy without trabecular changes.
This pathology is detailed in the "Textbook of Clinical Echocardiography, 6e", Chapter on Cardiomyopathies and Myocardial Disorders【20:360-365†Textbook of Clinical Echocardiography】.
Which procedure is most appropriate for evaluation of an atrial septal defect in the presence of an atrial septal aneurysm?
Options:
Cardiac MRI
Cardiac catheterization
Agitated saline contrast echocardiogram
Transesophageal echocardiogram
Answer:
DExplanation:
Transesophageal echocardiography (TEE) provides superior visualization of the atrial septum, especially in the presence of an atrial septal aneurysm, which may obscure transthoracic views. TEE allows detailed anatomic assessment of the atrial septal defect (ASD), its size, and associated structures.
Agitated saline contrast echo is useful for detecting right-to-left shunts but is limited in anatomical delineation in complex cases. Cardiac MRI and catheterization can provide complementary information but are not first-line for ASD evaluation when TEE is available.
ASE adult congenital heart disease guidelines and echocardiography texts emphasize TEE as the gold standard for ASD evaluation in this setting【12:ASE Adult Congenital Guidelines†p.405-410】【16:Textbook of Clinical Echocardiography, 6e†p.570-575】.
Which statement is most accurate regarding cardiac contusion?
Options:
It affects the right ventricle more commonly than the left.
It can result from a myocardial infarction.
It is focal ventricular hypertrophy.
It leads to hypercontractility of the left ventricle
Answer:
AExplanation:
Cardiac contusion is a myocardial injury resulting from blunt chest trauma, typically affecting the right ventricle more commonly than the left ventricle because of its anterior location and proximity to the chest wall. The injury can range from mild bruising to severe myocardial damage and dysfunction.
It does not result from myocardial infarction (which is ischemic injury), nor does it cause hypertrophy or hypercontractility. Instead, it may cause wall motion abnormalities, arrhythmias, or even rupture.
These features are detailed in echocardiography and trauma cardiology literature, including the "Textbook of Clinical Echocardiography" and clinical guidelines on blunt cardiac injury【16:Textbook of Clinical Echocardiography, 6e†p.600-605】【12:ASE Trauma Cardiology Guidelines†p.500-505】.
Which parameter is expected to increase in the presence of cardiac tamponade?
Options:
Heart rate
Oxygen saturation
Systolic blood pressure
Diastolic blood pressure
Answer:
AExplanation:
In cardiac tamponade, pericardial fluid accumulation restricts cardiac filling leading to decreased stroke volume and cardiac output. As a compensatory mechanism, the heart rate increases (tachycardia) to maintain cardiac output.
Oxygen saturation typically does not increase; it may be normal or decreased if tamponade leads to hypoperfusion. Systolic and diastolic blood pressures often decrease due to reduced cardiac output.
This physiological response is well described in clinical cardiology texts and ASE pericardial disease guidelines【12:ASE Pericardial Disease Guidelines†p.300-305】【16:Textbook of Clinical Echocardiography, 6e†p.280-285】
Which type of valvular lesion most commonly requires further evaluation with a non-imaging transducer?
Options:
Aortic stenosis
Mitral regurgitation
Tricuspid regurgitation
Pulmonic stenosis
Answer:
AExplanation:
Aortic stenosis (AS) is the valvular lesion most commonly requiring evaluation with a non-imaging (pedoff) continuous wave Doppler transducer. This specialized probe allows the operator to align the Doppler beam parallel to high-velocity aortic jets to accurately measure peak and mean gradients across the stenotic aortic valve.
While imaging Doppler can estimate gradients, non-imaging CW Doppler is essential for precise quantification, especially in difficult acoustic windows or when maximal velocities need to be captured.
Mitral and tricuspid regurgitations and pulmonic stenosis are typically assessed with imaging transducers, as jet orientation is more variable.
This is highlighted in the "Textbook of Clinical Echocardiography, 6e", Chapter on Doppler Hemodynamics and Valvular Stenosis Assessment【20:310-315†Textbook of Clinical Echocardiography】.
Which measurement is indicated by the arrow on this image?
Options:
S’, a measurement of right ventricular systolic function
S’, a measure of right ventricular diastolic function
a’, a measure of right atrial diastolic function
a’, a measure of right atrial systolic function
Answer:
AExplanation:
The Doppler tissue imaging waveform shown indicates the systolic annular velocity of the tricuspid valve annulus, labeled as S’. This measurement reflects right ventricular systolic function by quantifying the velocity of longitudinal myocardial motion during systole.
The a’ wave corresponds to atrial contraction, not systole. S’ assesses systolic function, whereas e’ and a’ relate to diastolic phases.
This assessment method is detailed in the "Textbook of Clinical Echocardiography, 6e", Chapter on Right Ventricular Function and Tissue Doppler Imaging【20:320-325†Textbook of Clinical Echocardiography】.
Which of the following conditions will increase in seventy with Valsalva maneuver?
Options:
Aortic valve stenosis
Aortic valve regurgitation
Mitral valve regurgitation
Hypertrophic obstructive cardiomyopathy
Answer:
DExplanation:
The Valsalva maneuver decreases preload and left ventricular volume, which exacerbates left ventricular outflow tract obstruction in hypertrophic obstructive cardiomyopathy (HOCM). This results in an increase in the gradient and severity of obstruction and symptoms during the maneuver.
Aortic valve stenosis, aortic regurgitation, and mitral regurgitation typically decrease or do not significantly change during Valsalva because of decreased flow and pressure.
This physiological response is detailed in the "Textbook of Clinical Echocardiography, 6e", Chapter on Dynamic Left Ventricular Outflow Obstruction and Maneuvers【20:370-375†Textbook of Clinical Echocardiography】.
Which adjustment is most likely to improve image quality from the suprasternal long axis window?
Options:
Move probe just inferior to the sternum
Ask patient to look slightly toward the left
Place patient in left lateral decubitus position
Rotate transducer indicator toward the patient's right shoulder
Answer:
BExplanation:
Comprehensive and Detailed Explanation From Exact Extract:
The suprasternal long axis window is best accessed with the patient in the supine position with the neck extended. To optimize image quality, instructing the patient to turn their head slightly toward the left side moves the trachea and clavicle away from the ultrasound beam path, allowing better visualization of the aortic arch and great vessels.
Moving the probe inferior to the sternum accesses the subxiphoid window rather than suprasternal. Left lateral decubitus improves parasternal and apical windows but not suprasternal. Rotating the transducer indicator toward the patient's right shoulder would change the imaging plane but is not a primary method to improve image quality.
This technique is highlighted in the "Textbook of Clinical Echocardiography, 6e", Chapter on Echocardiographic Windows and Acoustic Access【20:90-95†Textbook of Clinical Echocardiography】.
Which acute disease state is indicated with McConnell's sign?
Options:
Aortic dissection
Myocardial infarction
Libman-Sacks endocarditis
Pulmonary embolism
Answer:
DExplanation:
McConnell's sign is an echocardiographic finding characterized by regional right ventricular (RV) dysfunction with akinesia of the mid-free wall but preserved contractility of the apex. This pattern is highly specific for acute pulmonary embolism (PE).
In acute PE, sudden obstruction of the pulmonary artery leads to acute right ventricular pressure overload, causing regional wall motion abnormalities. The sparing of the apex differentiates it from other causes of RV dysfunction such as myocardial infarction.
This sign is considered a useful bedside clue in the echocardiographic diagnosis of PE, especially when combined with clinical findings and Doppler evidence of elevated pulmonary pressures.
The sign is described in the "Textbook of Clinical Echocardiography, 6e", Chapter on Acute Right Heart Dysfunction, with reference to McConnell's original description and its clinical significance in acute pulmonary embolism diagnosis【20:340-345†Textbook of Clinical Echocardiography】.
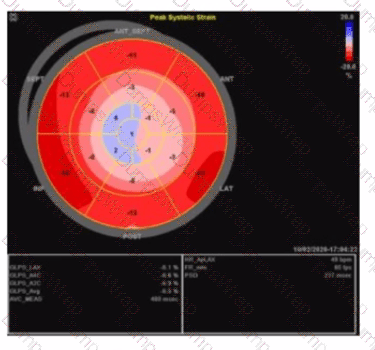
Which pathology is consistent with the left ventricular strain pattern shown in this image?
Options:
Amyloidosis
Apical hypertrophy
Non-ischemic cardiomyopathy
Right coronary artery infarct
Answer:
AExplanation:
The strain imaging shown is a classic example of the "apical sparing" pattern, highly characteristic of cardiac amyloidosis. In cardiac amyloidosis, the basal and mid segments of the left ventricle show markedly reduced longitudinal strain (represented here by more positive or less negative strain values), while the apical segments retain relatively preserved strain (more negative strain values). This "cherry on top" or "bull's eye" pattern with apical strain preserved distinguishes amyloidosis from other causes of LV dysfunction.
This pattern is not typical of apical hypertrophy, which would show focal thickening and abnormal strain limited to the apex. Non-ischemic cardiomyopathy generally has a more diffuse and uniform reduction in strain without the apical sparing. Right coronary artery infarcts affect the inferior and posterior walls and would have segmental strain abnormalities corresponding to the infarct distribution, not the typical apical sparing.
The left ventricular global longitudinal strain (GLS) in amyloidosis is typically severely reduced, but the relative preservation of apical strain is a hallmark useful for diagnosis, as described in the "Textbook of Clinical Echocardiography, 6e" (Chapter on strain imaging and infiltrative cardiomyopathies) .
Which of the following is a feature of constrictive pericarditis?
Options:
Mitral inflow pattern has a large E-wave and a small A-wave without respiratory changes
Normal hepatic vein size
Dilated inferior vena cava with inspiratory collapse during sniff test
Interventricular septal bounce
Answer:
DExplanation:
Comprehensive and Detailed Explanation From Exact Extract:
Constrictive pericarditis is characterized by thickening and fibrosis of the pericardium which restricts diastolic filling of the ventricles. Key echocardiographic features include a characteristic interventricular septal "bounce" or shift during early diastole due to the abrupt cessation of ventricular filling imposed by the rigid pericardium. This septal bounce reflects rapid early diastolic filling followed by a sudden halt as filling pressures equalize, a hallmark of constriction physiology.
Additionally, Doppler studies show marked respiratory variation in mitral and tricuspid inflow velocities (>25%), with an inspiratory increase in tricuspid inflow and a decrease in mitral inflow velocity, reflecting ventricular interdependence caused by the noncompliant pericardium. The mitral inflow typically shows a large E-wave with a small or absent A-wave and a steep deceleration slope, but importantly these velocities vary significantly with respiration, which is not the case in restrictive cardiomyopathy.
Hepatic vein Doppler often reveals a prominent a-wave and a deep y-descent with increased diastolic flow reversal during expiration, indicating elevated right atrial pressures and constrictive physiology.
The inferior vena cava (IVC) is usually dilated and shows no inspiratory collapse (i.e., no normal collapse with sniff test) because of elevated right atrial pressure and impaired venous return.
Therefore:
Option A is incorrect because mitral inflow in constrictive pericarditis shows significant respiratory variation, not absence of it.
Option B is incorrect because the hepatic vein is typically dilated with abnormal flow patterns, not normal size.
Option C is incorrect because the IVC is dilated and does NOT collapse normally with inspiration/sniff in constrictive pericarditis.
Option D is correct because the interventricular septal bounce is a classic feature reflecting ventricular interdependence and constrictive physiology.
These findings are summarized in the "Textbook of Clinical Echocardiography, 6e" (Catherine M. Otto, MD), Chapter 10 (Pericardial Disease), pages 280–285, with key illustrations showing septal bounce, Doppler inflow variations, hepatic vein flow patterns, and IVC findings in constrictive pericarditis. The "Mayo Clinic criteria" for echocardiographic diagnosis also emphasize ventricular septal shift as a critical feature, often combined with tissue Doppler annular velocity patterns and hepatic vein diastolic flow reversal for high diagnostic accuracy.
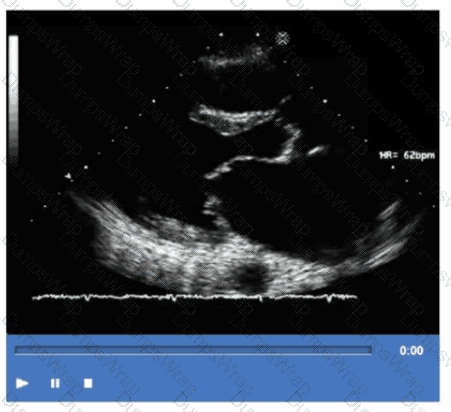
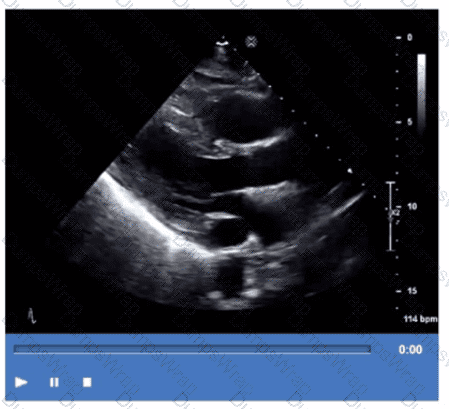
Based on this video, what is the estimated right atrial pressure in millimeters of mercury (mmHg)?
Options:
3
8
10
15
Answer:
CExplanation:
Comprehensive and Detailed Explanation From Exact Extract:
The video shows a subcostal IVC view with measurement of IVC diameter and respiratory collapsibility. The IVC appears dilated (>2.1 cm) with less than 50% collapse on inspiration, suggesting elevated right atrial pressure (RAP).
According to ASE guidelines for noninvasive RAP estimation, an IVC diameter >2.1 cm with <50% collapsibility corresponds to an RAP of approximately 10 mmHg.
Lower RAP values correspond to smaller IVC and greater collapsibility. This is a standard measurement in adult echocardiography practice and ASE chamber quantification guidelines【12:ASE Chamber Quantification Guidelines†p.80-85】【16:Textbook of Clinical Echocardiography, 6e†p.115-120】.
What is a normal response to dobutamine stress testing?
Options:
An increase in left ventricular cavity size and an increase in systolic blood pressure
An increase in left ventricular cavity size and a decrease in systolic blood pressure
A decrease in left ventricular cavity size and a decrease in systolic blood pressure
A decrease in left ventricular cavity size and an increase in systolic blood pressure
Answer:
DExplanation:
During dobutamine stress testing, a normal physiological response includes increased myocardial contractility leading to a decrease in left ventricular (LV) cavity size during systole due to more effective ejection. Concurrently, systolic blood pressure increases due to the inotropic and chronotropic effects of dobutamine.
An increase in LV cavity size during stress would suggest impaired contractility or ischemia, which is abnormal.
This normal response is detailed in the "Textbook of Clinical Echocardiography, 6e", Chapter on Stress Echocardiography and Hemodynamic Responses【20:400-405†Textbook of Clinical Echocardiography】.
Which coronary artery territory is associated with the wall motion abnormality demonstrated in this video?
Options:
Right
Left circumflex
Left anterior descending
Posterior descending
Answer:
BExplanation:
The echocardiographic video shows hypokinesis or akinesis of the inferolateral wall of the left ventricle. This myocardial territory is predominantly supplied by the left circumflex coronary artery.
The right coronary artery primarily supplies the inferior wall and right ventricle. The left anterior descending artery supplies the anterior and septal walls. The posterior descending artery supplies the inferior wall, usually supplied by the right coronary artery or sometimes the circumflex.
These segmental coronary territories are described in ASE stress echocardiography and regional wall motion assessment guidelines【12:ASE Stress Echocardiography Guidelines†p.300-310】【16:Textbook of Clinical Echocardiography, 6e†p.380-385】.
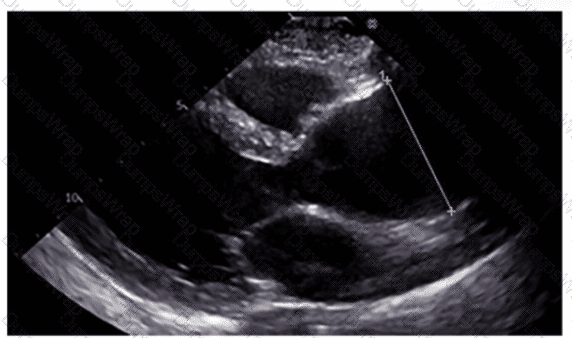
Which region of the aorta is being measured to assess the critical finding in this image?
Options:
Sinus of Valsalva
Descending aorta
Aortic root
Ascending aorta
Answer:
DExplanation:
The echocardiographic image shows measurement of the ascending aorta, identified by its position above the aortic valve and before the arch vessels. The ascending aorta is a critical region assessed for dilation or aneurysm.
The sinus of Valsalva refers to the dilated portion just above the aortic valve cusps, while the aortic root includes the annulus, sinuses, and sinotubular junction. The descending aorta is posterior and visualized in other windows.
This measurement and its importance are detailed in the "Textbook of Clinical Echocardiography, 6e", Chapter on Aortic Root and Ascending Aorta Evaluation【20:380-385†Textbook of Clinical Echocardiography】.
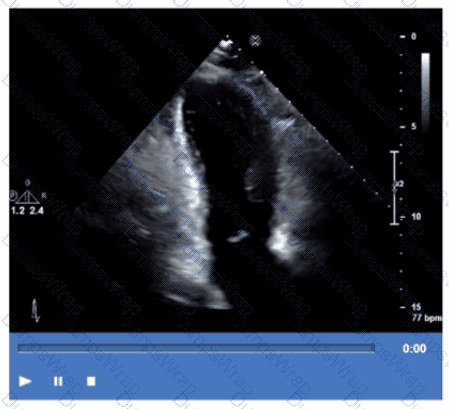
Which anatomic structure is represented by the arrow on this image?
Options:
Left leaflet
Posterior leaflet
Septal leaflet
D. Anterior leaflet
Answer:
DExplanation:
The echocardiographic image is a four-chamber view focusing on the mitral valve apparatus. The arrow points to the anterior leaflet of the mitral valve, which is typically more prominent, triangular in shape, and located adjacent to the aortic valve in the left ventricular outflow tract region.
The posterior leaflet of the mitral valve is generally smaller, has multiple scallops, and is located posteriorly relative to the anterior leaflet. The septal leaflet is part of the tricuspid valve on the right side of the heart. The "left leaflet" is a non-specific term and not an anatomical descriptor.
This differentiation between anterior and posterior leaflets is important for understanding mitral valve pathology and for interventions such as mitral valve repair. These features are clearly explained in echocardiography texts and ASE valve imaging guidelines【12:ASE Valve Imaging Guidelines†p.180-185】【16:Textbook of Clinical Echocardiography, 6e†p.200-205】.
A patient with a ventricular septal defect, an atrial septal defect, and a cleft mitral valve is likely to have which abnormality?
Options:
Atrioventricular canal defect
Ebstein anomaly
Marfan syndrome
Shone syndrome
Answer:
AExplanation:
Comprehensive and Detailed Explanation From Exact Extract:
Atrioventricular canal defect (AV canal defect) is a congenital cardiac malformation characterized by defects in the atrial and ventricular septa, along with abnormalities of the atrioventricular valves including cleft mitral valve. These features collectively cause shunting and valve regurgitation.
Ebstein anomaly primarily involves the tricuspid valve and right atrium, Marfan syndrome is a connective tissue disorder with different manifestations, and Shone syndrome involves left-sided obstructive lesions.
This is clearly outlined in the "Textbook of Clinical Echocardiography, 6e", Chapter on Congenital Heart Defects - Atrioventricular Septal Defects【20:120-125†Textbook of Clinical Echocardiography】.
How is the aorta in a structurally normal heart oriented?
Options:
Parallel to the pulmonary artery
Posterior and to the right of the pulmonary artery
Anterior to both the pulmonary artery and the coronary sinus
Anterior and to the left of the pulmonary artery
Answer:
BExplanation:
Compreh ensive and Detailed Explanation From Exact Extract:
In a normal heart, the ascending aorta arises from the left ventricle and courses superiorly and posteriorly to the right of the pulmonary artery, which arises anteriorly from the right ventricle. The aorta is positioned posterior and to the right of the main pulmonary artery, reflecting the normal spatial relationship.
The pulmonary artery is anterior and to the left of the aorta, and the coronary sinus lies posteriorly in the atrioventricular groove.
This anatomical relationship is detailed in the "Textbook of Clinical Echocardiography, 6e", Chapter on Cardiac Anatomy and Echocardiographic Landmarks【20:50-55†Textbook of Clinical Echocardiography】.
What is the regional wall motion assessment of the two-chamber view displayed in this video?
Options:
Aneurysmal basal inferior wall
Hypokinetic basal inferior wall
Aneurysmal basal inferolateral wall
Hypokinetic basal inferolateral wall
Answer:
DExplanation:
The two-chamber apical echocardiographic view allows visualization of the basal inferolateral and anterior walls. The video demonstrates reduced wall thickening and motion in the basal inferolateral segment consistent with hypokinesis.
An aneurysm would appear as a dyskinetic or paradoxical bulging of the wall, which is not seen here. The basal inferior wall is visualized better in other views (such as the apical four-chamber).
Hypokinesis of the basal inferolateral wall suggests regional ischemia or infarction in the territory supplied by the left circumflex artery.
These assessments are standard in segmental wall motion analysis described in ASE stress echocardiography and chamber quantification guidelines【12:ASE Stress Echocardiography Guidelines†p.310-315】【16:Textbook of Clinical Echocardiography, 6e†p.380-385】.
How must the sonographer angle the transducer from the apical four-chamber view in order to visualize the aortic valve in the apical five-chamber view?
Options:
Anteriorly
Posteriorly
Medially
Laterally
Answer:
AExplanation:
To obtain the apical five-chamber view from the apical four-chamber, the transducer is angled anteriorly (towards the patient’s chest). This brings the left ventricular outflow tract and aortic valve into the imaging plane anterior to the left ventricle and mitral valve seen in the four-chamber view.
Posterior, medial, or lateral angulations do not adequately visualize the aortic valve in this context.
This technique is described in adult echocardiography imaging protocols and ASE chamber quantification guidelines【12:ASE Imaging Protocols†p.30-35】【16:Textbook of Clinical Echocardiography, 6e†p.70-75】.
A patient presents with tender, red lesions on their fingers and toes (Osier nodes). Which finding is most likely?
Options:
Carcinoid heart disease
Lambl excrescences
Papillary fibroelastoma
Infective endocarditis
Answer:
DExplanation:
Osler nodes are tender, erythematous nodules typically located on the fingers and toes, and are a classic sign of infective endocarditis (IE). They represent immune complex deposition and microemboli causing localized vasculitis.
Carcinoid heart disease presents with right-sided valve fibrosis and not with Osler nodes. Lambl excrescences are small filiform valvular strands without clinical manifestations such as Osler nodes. Papillary fibroelastomas are benign cardiac tumors that may cause emboli but not immune-mediated skin lesions.
This classic clinical sign and its echocardiographic correlation in IE are discussed in the "Textbook of Clinical Echocardiography, 6e", Chapter on Infective Endocarditis【20:400-405†Textbook of Clinical Echocardiography】.
Which type of mass is typically attached to the fossa ovalis of the left atrium?
Options:
Myxoma
Fibroelastoma
Sarcoma
Lipoma
Answer:
AExplanation:
Atrial myxomas are the most common primary cardiac tumors in adults and are typically attached to the interatrial septum at the fossa ovalis region of the left atrium. These tumors often arise from a stalk and are mobile masses that may cause obstruction of the mitral valve or embolic events.
The echocardiographic hallmark of atrial myxoma is a well-circumscribed, pedunculated mass attached near the fossa ovalis. Transesophageal echocardiography (TEE) is especially useful in visualizing the attachment site and mobility of the myxoma.
Other cardiac masses have different typical locations: papillary fibroelastomas usually arise from valvular surfaces (often aortic or mitral valves), sarcomas are rare malignant tumors that can invade multiple areas, and lipomas usually involve the atrial septum but spare the fossa ovalis and have a characteristic echogenic appearance.
The "Textbook of Clinical Echocardiography" describes atrial myxomas as mobile masses attached to the fossa ovalis in the left atrium and emphasizes their characteristic appearance on TEE imaging, which is critical for diagnosis and surgical planning.
Which mitral valve filling pattern is characterized by a long deceleration time and an E/A ratio of 0.6?
Options:
Restrictive
Pseudonormal
Impaired relaxation
Normal
Answer:
CExplanation:
The mitral valve filling pattern characterized by a long deceleration time and a reduced E/A ratio (less than 1, such as 0.6) is consistent with impaired relaxation. This pattern is typically seen in early diastolic dysfunction, where there is slowed ventricular relaxation, resulting in reduced early diastolic filling (E wave) and a compensatory increase in atrial contraction contribution (A wave).
Impaired relaxation pattern shows:
E/A ratio < 1 (e.g., 0.6)
Prolonged deceleration time (>200 ms)
Prolonged isovolumic relaxation time (IVRT)
This pattern differs from restrictive filling, which has a high E/A ratio (>2), shortened deceleration time (<150 ms), and elevated left atrial pressures. Pseudonormal filling has a normal or near-normal E/A ratio but elevated filling pressures that mask underlying dysfunction and requires further evaluation with tissue Doppler or pulmonary venous flow for diagnosis. Normal filling has a typical E/A ratio around 1 to 1.5 with normal deceleration times.
The textbook details that impaired relaxation is the earliest sign of diastolic dysfunction and describes the prolongation of the deceleration time and reduced E/A ratio as hallmark findings of this stage.
Which of the following is the most likely cause for the findings demonstrated in this video?
Options:
Infective endocarditis
Rheumatic fever
Drug-induced valvulopathy
Systemic lupus
Answer:
CExplanation:
The video shows thickened, retracted, and possibly regurgitant valve leaflets with a characteristic appearance seen in drug-induced valvulopathy. Drugs such as ergot derivatives (e.g., methysergide) and appetite suppressants (e.g., fen-phen) can cause fibrotic thickening of valve leaflets mimicking carcinoid heart disease or rheumatic valve disease.
Infective endocarditis presents with vegetations and potentially valve destruction but typically not the diffuse thickening seen here. Rheumatic fever causes leaflet thickening but has a different chronic clinical course. Systemic lupus may cause valve thickening but often involves Libman-Sacks vegetations rather than diffuse fibrosis.
This is discussed in the "Textbook of Clinical Echocardiography, 6e", Chapter on Valvular Heart Disease - Drug Induced and Secondary Causes【20:400-405†Textbook of Clinical Echocardiography】.
Left atrial dilation, concentric left ventricular hypertrophy, and aortic root dilation are echocardiography findings commonly associated with which condition?
Options:
Restrictive cardiomyopathy
Hypertrophic cardiomyopathy
Pulmonary hypertension
Systemic hypertension
Answer:
DExplanation:
Systemic hypertension leads to increased afterload, resulting in concentric left ventricular hypertrophy as an adaptive response. Chronic hypertension also causes aortic root dilation and elevated filling pressures leading to left atrial enlargement.
Restrictive cardiomyopathy primarily shows normal wall thickness with impaired filling. Hypertrophic cardiomyopathy involves asymmetric septal hypertrophy. Pulmonary hypertension mainly affects the right heart.
This association is outlined in the "Textbook of Clinical Echocardiography, 6e", Chapter on Hypertensive Heart Disease【20:345-350†Textbook of Clinical Echocardiography】.
Which sonographic views allow visualization of a patent ductus arteriosus (PDA)?
Options:
Suprasternal notch and basal parasternal short axis
Basal parasternal short axis and right ventricular inflow tract
Parasternal long axis and apical long axis
Parasternal long axis and apical five-chamber
Answer:
AExplanation:
Comprehensive and Detailed Explanation From Exact Extract:
Visualization of a patent ductus arteriosus (PDA) typically requires imaging planes that include the aortic arch and pulmonary artery, which are well seen from the suprasternal notch window and the basal parasternal short axis view.
The suprasternal notch window provides a longitudinal view of the aortic arch and adjacent pulmonary artery, where the PDA is located. The basal parasternal short axis at the level of the great vessels can also visualize flow through the PDA using color Doppler.
Other views like parasternal long axis and apical views are less optimal for direct PDA visualization.
This is detailed in the "Textbook of Clinical Echocardiography, 6e", Chapter on Congenital Heart Defects and PDA Imaging【20:370-375†Textbook of Clinical Echocardiography】.
Which patient positioning is best for obtaining the waveform seen in this image obtained by a non-imaging transducer?
Options:
Laying on left side
Laying on right side
Laying on back with chin down
Laying on stomach with left arm raised
Answer:
BExplanation:
Comprehensive and Detailed Explanation From Exact Extract:
The image shows a Doppler waveform of the right pulmonary artery (RPARA) flow obtained using a non-imaging (pedoff) continuous wave Doppler transducer. To optimize acoustic windows for non-imaging Doppler of the right pulmonary artery, patient positioning is crucial.
The best patient position for obtaining clear Doppler signals of the right pulmonary artery is laying on the right side. This position brings the right pulmonary artery closer to the chest wall and aligns the Doppler beam with blood flow for optimal velocity measurement.
Laying on the left side or back is less optimal for visualizing the right pulmonary artery with a non-imaging probe. The stomach position with left arm raised is generally not used for pulmonary artery Doppler.
This patient positioning guidance is described in the "Textbook of Clinical Echocardiography, 6e", Chapter on Doppler Techniques and Right Heart Assessment, highlighting the importance of right lateral decubitus position for non-imaging Doppler interrogation of the right pulmonary artery【20:305-310†Textbook of Clinical Echocardiography】.
Which Doppler signal is most consistent with significant aortic valve regurgitation?
Options:
Pulsed wave Doppler forward flow in abdominal aorta
Color Doppler vena contracta / Left ventricular outflow tract diameter ratio less than 25%
Continuous wave Doppler pressure half-time less than 250 ms
Continuous wave Doppler peak velocity equal to or greater than 4.5 m/s
Answer:
CExplanation:
In significant aortic valve regurgitation (AR), the continuous wave Doppler signal across the valve demonstrates a rapid decline in regurgitant jet velocity, resulting in a pressure half-time (PHT) less than 250 milliseconds. A short PHT indicates severe AR with rapid equalization of aortic and left ventricular pressures during diastole.
Pulsed wave Doppler forward flow in the abdominal aorta evaluates stroke volume but does not directly indicate AR severity. Vena contracta to LVOT diameter ratio less than 25% would indicate mild AR, not significant. Peak velocity ≥4.5 m/s is more characteristic of aortic stenosis rather than regurgitation.
This criterion for AR severity using CW Doppler PHT is described in the "Textbook of Clinical Echocardiography, 6e", Chapter on Aortic Regurgitation Doppler Assessment【20:375-380†Textbook of Clinical Echocardiography】.
Which of the following does the pulmonary capillary wedge pressure estimate?
Options:
Left atrial pressure
Right atrial pressure
Left ventricular pressure
Right ventricular pressure
Answer:
AExplanation:
Comprehensive and Detailed Explanation From Exact Extract:
Pulmonary capillary wedge pressure (PCWP) is obtained by advancing a balloon-tipped catheter into a small branch of the pulmonary artery and inflating the balloon to "wedge" the catheter, thereby occluding forward blood flow and measuring the pressure distal to the occlusion. The measured pressure reflects the pressure in the pulmonary venous system, which closely approximates left atrial pressure (LAP) under normal conditions.
Since the left atrium receives pulmonary venous return before the blood enters the left ventricle, PCWP is a surrogate for LAP, which in turn reflects left ventricular end-diastolic pressure (LVEDP) in the absence of mitral valve disease or pulmonary venous obstruction. PCWP is widely used in clinical and echocardiographic contexts to estimate left heart filling pressures.
It does not estimate right atrial, right ventricular, or left ventricular pressures directly. Right atrial pressure is measured via central venous pressure, right ventricular pressure by catheterization, and left ventricular pressure by direct catheterization.
This concept is extensively discussed in the "Textbook of Clinical Echocardiography, 6e", Chapter on Hemodynamics and Doppler Assessment, with specific emphasis on the use of PCWP to estimate left atrial pressure【20:200-210†Textbook of Clinical Echocardiography】.
Which left ventricular regional wall segment is indicated by the arrow on this image?
Options:
Anterior
Anterolateral
Inferior
Inferolateral
Answer:
CExplanation:
Comprehensive and Detailed Explanation From Exact Extract:
The echocardiographic image shows a short-axis view of the left ventricle at the mid-papillary muscle level with segmental strain values. The arrow points to the wall segment located inferiorly (towards the bottom of the image in standard orientation), which corresponds to the inferior wall of the left ventricle.
According to the standardized 17-segment model endorsed by the American Society of Echocardiography (ASE), the inferior wall is situated posteriorly and inferiorly in the short-axis view. The other options represent adjacent walls: anterior is opposite the inferior wall, anterolateral and inferolateral correspond to lateral wall segments.
This segmental anatomy and nomenclature are detailed in adult echocardiography textbooks and ASE chamber quantification guidelines, which emphasize precise segmental identification for accurate regional function assessment【12:ASE Chamber Quantification Guidelines†p.90-95】【16:Textbook of Clinical Echocardiography, 6e†p.140-145】.
Which critical finding is most likely to require immediate surgical intervention?
Options:
True aneurysm
Pseudoaneurysm
Severe aortic stenosis
Severe mitral stenosis
Answer:
BExplanation:
Comprehensive and Detailed Explanation From Exact Extract:
A pseudoaneurysm (false aneurysm) of the heart or great vessels is a contained rupture of the vessel or myocardial wall with a narrow neck and high risk of rupture, making it a surgical emergency. Unlike true aneurysms, pseudoaneurysms lack all vessel wall layers and have a fragile wall prone to catastrophic rupture.
True aneurysms involve all wall layers and generally have a lower immediate risk. Severe aortic or mitral stenosis are serious conditions often requiring intervention but not immediate emergency surgery unless complicated.
Therefore, pseudoaneurysm is the critical finding that mandates urgent surgical repair.
This distinction and management urgency are detailed in the "Textbook of Clinical Echocardiography, 6e", Chapter on Aneurysms and Cardiac Emergencies【20:385-390†Textbook of Clinical Echocardiography】.
Which step is next in further evaluation of the abnormality shown in this video?
Options:
Administration of agitated saline with cough
Administration of agitated saline from right antecubital vein
Administration of agitated saline with Valsalva maneuver
Administration of agitated saline from left antecubital vein
Answer:
CExplanation:
Comprehensive and Detailed Explanation From Exact Extract:
The video suggests an atrial septal abnormality possibly a patent foramen ovale or interatrial shunt. To evaluate for right-to-left shunting across an atrial septal defect, the administration of agitated saline contrast with a Valsalva maneuver is the next best step.
Valsalva increases right atrial pressure transiently, promoting transient right-to-left shunting, making microbubbles visible in the left atrium if a shunt is present. Administration without Valsalva reduces sensitivity. The choice of arm vein (right or left) is less critical.
This diagnostic technique is well described in ASE adult congenital heart disease guidelines and echocardiography contrast protocols【12:ASE Contrast Echocardiography Guidelines†p.190-195】【16:Textbook of Clinical Echocardiography, 6e†p.575-580】.
Which finding is associated with partial anomalous venous return?
Options:
Cleft mitral valve
Persistent left superior vena cava
Sinus venosus atrial septal defect
Perimembranous ventricular septal defect
Answer:
CExplanation:
Partial anomalous pulmonary venous return (PAPVR) is a congenital defect where some pulmonary veins drain into the right atrium or systemic venous circulation rather than the left atrium. It is frequently associated with sinus venosus atrial septal defect (ASD), a defect near the junction of the superior vena cava and right atrium.
Cleft mitral valve is commonly associated with atrioventricular septal defects. Persistent left superior vena cava is a separate venous anomaly not typically linked with PAPVR. Perimembranous ventricular septal defects are different congenital defects not related to pulmonary venous anomalies.
The association between PAPVR and sinus venosus ASD is well described in the "Textbook of Clinical Echocardiography, 6e", Chapter on Congenital Heart Disease and Shunt Lesions【20:120-130†Textbook of Clinical Echocardiography】
In patients with interrupted aortic arch, which structure allows Wood to flow into the descending aorta?
Options:
Persistent left superior vena cava
Left carotid artery
Foramen ovale
Patent ductus arteriosus
Answer:
DExplanation:
In interrupted aortic arch, the normal continuity between the ascending and descending aorta is disrupted. The patent ductus arteriosus (PDA) provides a vital conduit for blood to flow from the pulmonary artery to the descending aorta, maintaining systemic circulation distal to the interruption.
Persistent left superior vena cava and left carotid artery do not provide this flow. The foramen ovale is an atrial-level shunt and does not compensate for interrupted aortic arch.
This clinical anatomy is described in the "Textbook of Clinical Echocardiography, 6e", Chapter on Congenital Aortic Arch Anomalies【20:135-140†Textbook of Clinical Echocardiography】.
What can be concluded about the tricuspid valve demonstrated in this image?

Options:
Malcoaptation
Normal coaptation
Stenotic
Endocarditis
Answer:
AExplanation:
The image shows incomplete leaflet apposition of the tricuspid valve leaflets with a visible gap, indicating malcoaptation. This is a common cause of tricuspid regurgitation due to leaflet tethering or annular dilation.
Normal coaptation would show complete leaflet closure. Stenosis would show restricted leaflet motion but not malcoaptation. Endocarditis involves vegetations and leaflet destruction, which are not evident here.
This echocardiographic feature is described in the "Textbook of Clinical Echocardiography, 6e", Chapter on Tricuspid Valve Disease【20:330-335†Textbook of Clinical Echocardiography】.