Designing and Implementing Enterprise Network Assurance(300-445 ENNA) Questions and Answers
An engineer deployed a Cisco ThousandEyes Enterprise Agent on a Meraki MX to monitor a critical SaaS application. Which kind of monitoring has the engineer set up?
Options:
active monitoring
passive monitoring
agentless monitoring
server monitoring
Answer:
AExplanation:
In theDesigning and Implementing Enterprise Network Assurance (300-445 ENNA)curriculum, understanding the distinction between different monitoring methodologies is fundamental to architecting an effective assurance strategy. When an engineer deploys aThousandEyes Enterprise Agenton a Meraki MX appliance, they are implementingactive monitoring.
Active monitoring, as defined in standard network assurance frameworks like RFC 7799, involves the generation of synthetic traffic or "probes" that are sent across the network to a specific destination. These probes, which can utilize protocols such as ICMP, TCP, or HTTP/S, simulate real user transactions to measure performance metrics including latency, packet loss, jitter, and path visualization. The Enterprise Agent acts as a dedicated vantage point, executing these tests at scheduled intervals to provide a proactive baseline of network and application health. This allows the engineer to identify performance degradation or outages even when no real users are actively using the application, ensuring that issues are detected before they impact the business.
It is important to contrast this withpassive monitoring(Option B). In the Meraki ecosystem,Meraki Insight (MI)natively performs passive monitoring by observing and analyzing actual user traffic flows (HTTP/S data) as they traverse the MX appliance without injecting additional traffic. While passive monitoring is excellent for understanding real-world user experience and server response times, it relies on existing traffic and cannot provide hop-by-hop path visualization across the Internet in the same way active synthetic probing does.
By integrating the ThousandEyes Enterprise Agent—which runs as a containerized service within the MX architecture—the engineer gains the benefits of active monitoring directly from the branch edge. This eliminates the need for separate hardware and provides deep, "outside-in" and "inside-out" visibility into SaaS application performance. Therefore, the deployment of a ThousandEyes agent explicitly enablesactive monitoring(Option A) to supplement the native passive capabilities of the Meraki platform.
What is the primary purpose of integrating ThousandEyes with Meraki?
Options:
To deploy Endpoint Agents for VPN connectivity monitoring
To monitor external applications and services from SD-WAN sites
To enhance cloud security and compliance
To manage user access policies and permissions
Answer:
BExplanation:
TheDesigning and Implementing Enterprise Network Assurance (300-445 ENNA)framework highlights the integration between ThousandEyes and Cisco Meraki as a solution for "cross-domain assurance".5The primary purpose of this integration is tomonitor external applications and services from SD-WAN sites(Option B).
In a distributed Meraki environment, IT teams often struggle with visibility into the "Internet as a WAN," where performance issues may occur outside the local network perimeter. By embeddingThousandEyes Enterprise Agentsnatively withinMeraki MX appliances, organizations can bridge the gap between internal LAN metrics and external service health.6This integration allows for proactive monitoring of SaaS platforms (like Microsoft 365, Salesforce, and Webex) and other public-facing dependencies using synthetic probes. It complements the nativeMeraki Insight (MI), which provides passive monitoring of real user traffic, by adding active path visualization and hop-by-hop analysis across the Internet.
Key advantages of this integration include:
One-Click Activation:Enabling the ThousandEyes agent directly from the Meraki Dashboard without additional hardware.7
Pre-configured Templates:Using built-in test templates for common SaaS applications to accelerate troubleshooting.8
Isolation of Fault Domains:Quickly determining if a user's lag is caused by a local Wi-Fi issue (via Meraki wireless metrics) or an ISP routing problem (via ThousandEyes path data).9
While ThousandEyes does provide visibility for VPN and security, Options A, C, and D are not theprimaryfocus of the specific Meraki-ThousandEyes integration architecture, which is centered on extending application performance assurance to distributed branch locations.
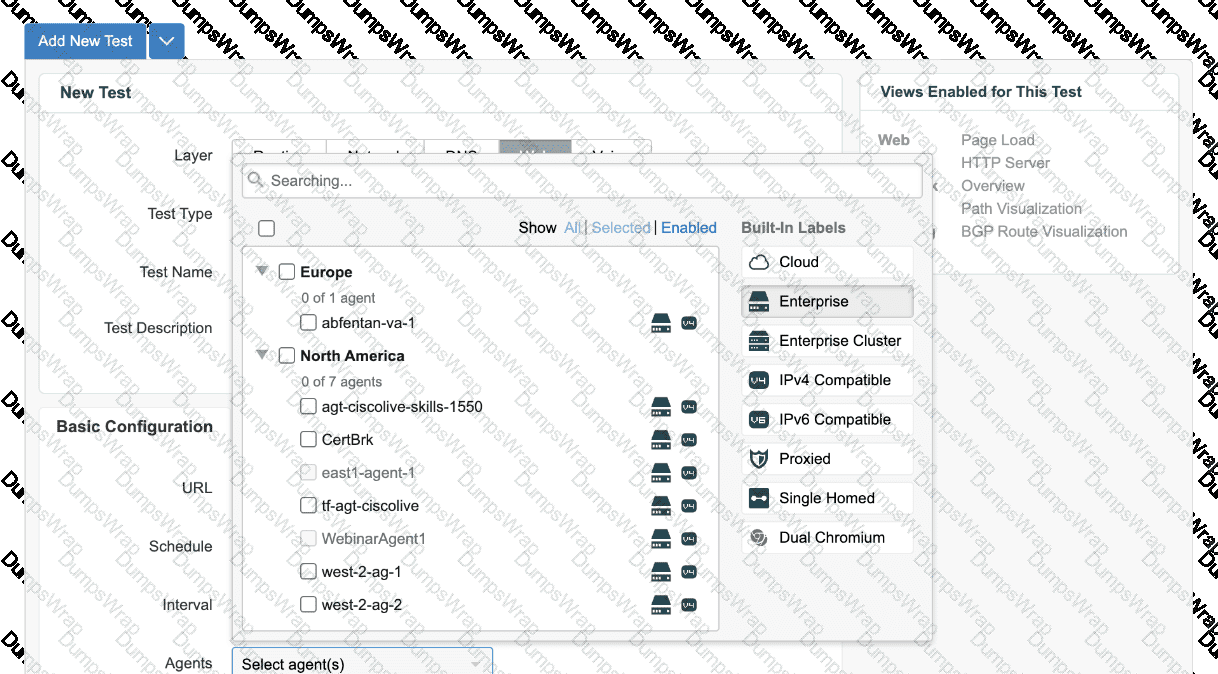
An engineer is trying to configure a Page Load test and is trying to assign the east1-agent-1 to run it, but cannot see that agent listed. What is the reason that the designated agent does not appear?
Options:
The agent is not running
The agent is disabled
The agent is still registering
The agent does not support Page load tests
Answer:
DExplanation:
In the framework ofDesigning and Implementing Enterprise Network Assurance (300-445 ENNA), selecting the appropriate agent for specific test types is a critical configuration step. The ThousandEyes platform utilizes different agent binaries and capabilities depending on the underlying hardware and software environment. Specifically,Page Load testsandTransaction testsrequire the agent to have a browser engine (Chromium) installed and functional to render web content and measure DOM-related metrics.
According to the ENNA implementation guidelines, not all Enterprise Agents support these browser-based tests. The exhibit displays a "New Test" configuration screen where the engineer is searching for "east1-agent-1". While other agents like "west-2-ag-1" are visible, the designated agent is missing because itdoes not support Page load tests(Option D). This common occurrence happens when an Enterprise Agent is deployed on resource-constrained hardware—such as certainCisco Catalyst 9000 switchesorCisco ISR 4000 series routers—where the Chromium browser package is either not supported or has not been enabled due to memory and CPU limitations.
When an agent lacks the required capabilities for a specific test layer (e.g., Web layer tests), it is automatically filtered out from the selection list in the ThousandEyes portal to prevent invalid test configurations. To identify compatible agents, an engineer can look for the "Browser" or "Dual Chromium" labels in the agent settings. If the "east1-agent-1" were merely offline (Option A), disabled (Option B), or still registering (Option C), it would typically still appear in the list but with a status indicator showing its unavailability, rather than being entirely hidden from the test assignment menu. Therefore, the absence of the agent in a web-layer test configuration explicitly indicates a lack of functional support for the required browser-based metrics.
A network engineer is investigating widespread reports of poor performance for a data center-hosted web application. Which ThousandEyes agent type would be most effective for quickly identifying the root cause?
Options:
Synthetic Agent
Enterprise Agent
Endpoint Agent
Cloud Agent
Answer:
DExplanation:
According to theDesigning and Implementing Enterprise Network Assurance (300-445 ENNA)guidelines, troubleshooting widespread performance issues for a public or data center-hosted app17lication requires an "outside-in" perspective. When reports are widespread,18the goal is to determine if the issue is global, regional, or specific to certain ISP paths leading to the data center.
TheCloud Agent(Option D) is the most effective tool for this task because these agents are maintained by Cisco ThousandEyes in over 240+ locations worldwide within Tier 1, 2, and 3 ISPs and cloud provider regions.19Because they arepre-deployed and immediately available, a network engineer can instantly run tests from multiple global locations toward the data center-hosted application without having to install any software or manage any infrastructure. This allows the engineer to quickly compare performance metrics (latency, loss, and page load times) across different geographies. If Cloud Agents in London report no issues while those in New York report high packet loss, the engineer can immediately pinpoint the root cause as a regional ISP or peering issue rather than a failure within the data center itself.
Enterprise Agent (Option B):While these could be used if they were already installed in various branch offices, they require ownership of the infrastructure and deployment time. They are better suited for "inside-out" monitoring.
Endpoint Agent (Option C):These are useful for troubleshooting individual user experience but are not the "quickest" way to baseline global performance against a data center application during a widespread event.
Synthetic Agent (Option A):As noted previously, this is a generic term describing the underlying technology used by all ThousandEyes agent types.
Therefore,Cloud Agentsprovide the necessary breadth and immediate availability to perform rapid root cause analysis for widespread application performance issues.
Which deployment option should a network administrator use to deploy the ThousandEyes Endpoint Agent to all users on their internal domain using a Microsoft Domain Controller?
Options:
Microsoft Intune
Group Policy Objects
JAMF
Power Shell
Answer:
BExplanation:
For theDesigning and Implementing Enterprise Network Assurance (300-445 ENNA)exam, understanding enterprise-scale deployment of the Endpoint Agent (EPA) is vital for ensuring comprehensive user-centric visibility. When an organization utilizes aMicrosoft Domain Controllerto manage its internal domain, the standard mechanism for automated software distribution isGroup Policy Objects (GPOs)(Option B).
Deploying the ThousandEyes Endpoint Agent via GPO allows a network administrator to push the .msi installer package to all Windows-based workstations joined to the domain. This method is highly effective for large-scale environments because it ensures that the agent is installed automatically upon machine startup or user login, without requiring manual intervention from the end-user or the IT staff at each individual machine. The GPO can be configured to perform a "silent installation," which runs in the background, ensuring a seamless experience for the employees while providing the IT team with the necessary performance metrics.
WhileMicrosoft Intune (Option A)is a modern cloud-based endpoint management solution, the question specifically references aMicrosoft Domain Controller, making GPO the most direct and traditional choice for that specific infrastructure.JAMF (Option C)is specifically for Apple (macOS/iOS) device management and would not be used for a Windows domain deployment.8PowerShell (Option D)can be used for scripting, but it lacks the centralized policy enforcement and automatic compliance checking provided by GPOs in an Active Directory environment. Therefore,Group Policy Objectsis the verified deployment method for this scenario.
A CPU utilization alert for Endpoint Agents is triggering too frequently, creating alert noise. Which of the following steps would help reduce the sensitivity of the alert rule? (Select two)
Options:
Increase the number of agents that must exceed the CPU threshold to trigger the alert
Lower the CPU utilization percentage in the alert condition
Adjust the alert rule to require more rounds of data to exceed the threshold
Enable the alert rule on more Endpoint Agents
Answer:
A, CExplanation:
Alert fatigue is a major operational challenge in network assurance. To make a CPU utilization alert for Endpoint Agents less sensitive and reduce "noise," an engineer must implement statistical filters that ignore transient spikes or isolated events.
The two most effective methods are:
Increase the agent count (Option A):By requiring a higher number or percentage of agents to simultaneously exceed the threshold, the system ensures the alert represents a widespread environmental issue rather than a single user running a CPU-intensive background process.
Require more rounds of data (Option C):Instead of alerting on a single measurement (1 of 1 round), the engineer can configure the rule to require the threshold to be breached for multiple consecutive checks (e.g., 2 of 3 rounds). This filters out brief, non-impactful CPU spikes that occur naturally during OS updates or browser startups.
Other options would have the opposite effect:
Option B:Lowering the percentage threshold (e.g., from 90% to 50%) would cause the alert to trigger much more frequently, increasing noise.
Option D:Enabling the alert on more agents increases the pool of potential triggers, which typically leads to more notifications unless the logic in Option A is also applied.
An administrator has set up GPO properly, but realized ThousandEyes EPA was not deployed on one of the office PCs.9 What is the appropriate first step?
Options:
After GPO deployment, an administrator account must log in to deploy the EPA
Check that the PC belongs to the needed domain
Reboot the PC, this will restart GPO on the server
Reboot the Server, this will restart GPO on the PC
Answer:
BExplanation:
In theDesigning and Implementing Enterprise Network Assurance (300-445 ENNA)curriculum, troubleshooting deployment issues is as critical as the initial configuration. When utilizingGroup Policy Objects (GPOs)for the distribution of the ThousandEyes Endpoint Agent (EPA), certain prerequisites must be met for the policy to take effect on a target machine.10
The most fundamental requirement is that the target PC must be a member of the domain or the specific Organizational Unit (OU) where the GPO is linked. Therefore, the appropriate first step is tocheck that the PC belongs to the needed domain(Option B). GPOs are scoped based on Active Directory membership; if a computer is in a workgroup or a different domain/OU that is not targeted by the policy, it will never receive the instruction to install the software, regardless of how "properly" the GPO is configured on the server.11
The other options are technically incorrect or represent a misunderstanding of GPO mechanics:
Administrator Login (Option A):EPA installation via GPO is typically configured to run under the System account context during startup, meaning it is not dependent on a specific user (administrator or otherwise) logging in to trigger the deployment.
Rebooting to restart GPO on the server (Option C):Rebooting a client PC triggers a "GPUpdate" request from the client to the server, but it does not "restart" the GPO service on the server side.
Rebooting the Server (Option D):This is an invasive and unnecessary step that will not force a policy update on a specific client PC if that PC is not correctly joined to the domain or is experiencing a local networking issue.
By verifying domain membership first, the administrator ensures the basic trust and communication path required for GPO delivery is functional before moving to more complex troubleshooting steps like checking event logs or network connectivity.
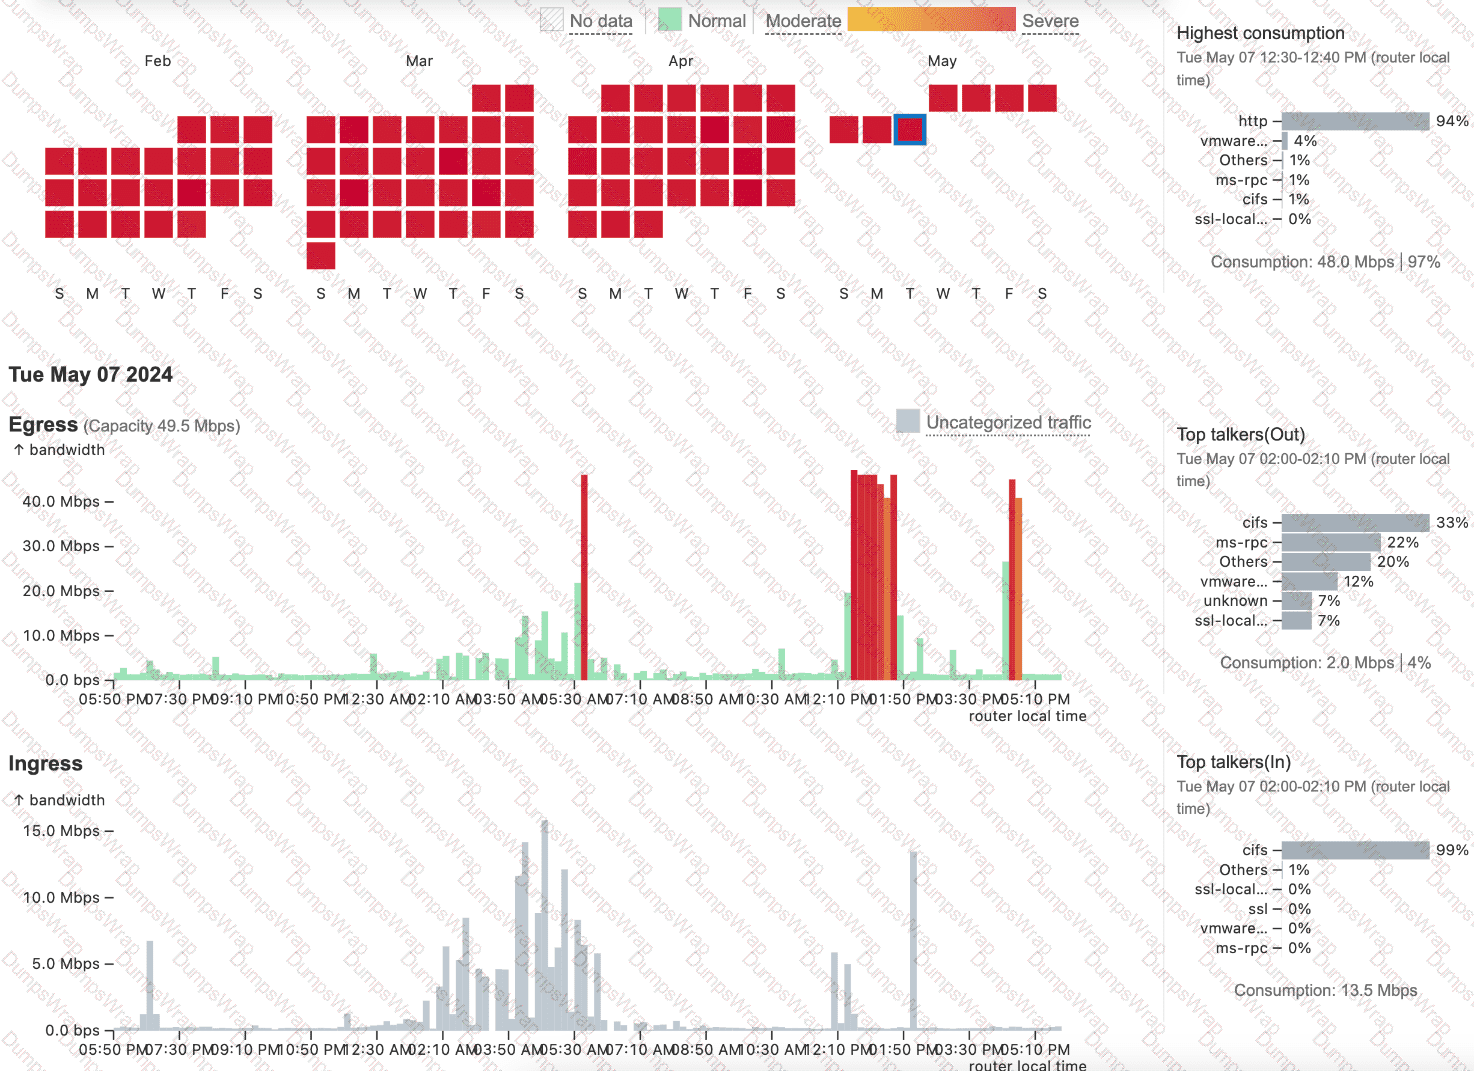
The following exhibit shows the Capacity Planning results for a router interface connected to an ISP, which provides a 1Gbps connection. Based on the evidence, which action is most likely to fix the observed behavior?
Options:
Request a link increase from the ISP
Reconfigure maximum capacity for the interface
Restrict the Web Sites that can be visited from the site
Reconfigure business hours settings
Answer:
BExplanation:
In the context ofDesigning and Implementing Enterprise Network Assurance (300-445 ENNA), capacity planning requires accurate baselining of interface bandwidth against its theoretical and provisioned limits. AnalyzingExhibit 4.5 Question 4(image_79d4fc.jpg) reveals a significant discrepancy between the physical reality of the link and its configuration within the monitoring tool.
The exhibit displays a capacity planning dashboard with a calendar heatmap and traffic graphs. The heatmap for February through May shows a high frequency of "Severe" (red) utilization blocks. Looking at theEgressgraph forTue May 07 2024, the traffic spikes clearly exceed 40.0 Mbps. Crucially, the dashboard indicates an "Egress Capacity" of49.5 Mbpsand reports that the "Highest consumption" was 48.0 Mbps, representing97%of the available bandwidth.
However, the question states that the ISP provides a1 Gbps (1000 Mbps) connection. Since the actual traffic being sent is less than 50 Mbps, the link is nowhere near physical saturation. The "Severe" alerts and high utilization percentages are occurring only because the monitoring software (likely ThousandEyes or a similar NMS) is configured with aMaximum Capacityof only 49.5 Mbps for this interface. This misconfiguration causes the tool to calculate utilization based on a much smaller "pipe" than what actually exists, leading to false-positive alerts.
Therefore, the most likely action to fix this observed behavior is toreconfigure maximum capacity for the interface(Option B) to match the 1 Gbps specification.
Option Ais unnecessary because the current link is only being utilized at ~5% of its 1 Gbps potential.
Option Cis a restrictive policy change that is not justified given the actual available headroom.
Option Dmight shift how data is displayed but will not fix the underlying mathematical error in utilization calculations.
Refer to the exhibit.
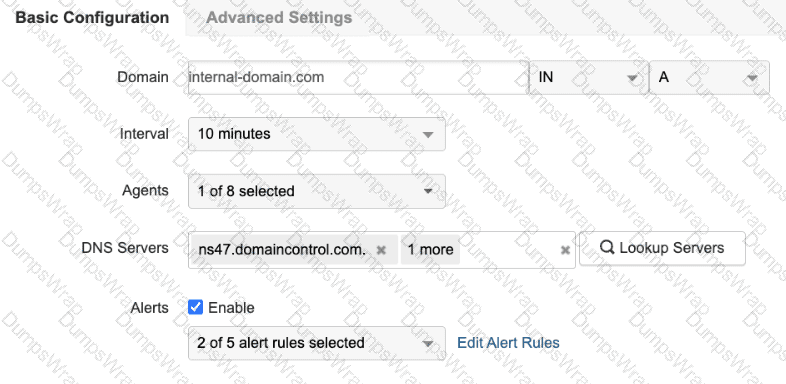
A network admin has been tasked with monitoring the IPv6 record and name server resolution times with different agents. Select the two actions that the engineer must take to meet the requirements.
Options:
Create a DNS Server test monitoring the A record
Create a DNS Server test monitoring the AAAA record
Create a DNS Trace test monitoring the ANY record
Create a DNS Server test monitoring the NS record
Create a DNS Trace test monitoring the NS record
Answer:
B, DExplanation:
According to theDesigning and Implementing Enterprise Network Assurance (300-445 ENNA)curriculum, DNS testing is a fundamental component of ensuring application availability and performance. The ThousandEyes platform provides two primary types of DNS tests:DNS ServerandDNS Trace.
To satisfy the specific requirements of monitoringIPv6 recordsandname server resolution times, the engineer must utilize theDNS Server test. This test type is designed to measure the performance of specific DNS servers by querying them for particular resource records.
Monitoring IPv6 Records:In the DNS system, IPv6 address records are known asAAAA records. Therefore, to monitor the availability and resolution of IPv6 addresses for a domain, the engineer must create a DNS Server test and set the query type toAAAA(Option B).
Monitoring Name Server Resolution Times:To measure how long it takes for a DNS server to return the authoritative name servers for a domain, the engineer must query forNS (Name Server) records. By creating a DNS Server test targeting theNS record(Option D), the platform can provide granular metrics on the response time and availability of those specific records from the perspective of the selected agents.
DNS Trace tests(Options C and E) are less suitable for measuring specific resolutiontimesof a single server; instead, they are used to visualize the entire delegation path from the root servers down to the authoritative servers to identify where a "break" in the chain occurs. Furthermore, anA recordquery (Option A) only provides the IPv4 address, failing the requirement to monitor IPv6. By selectingDNS Servertests forAAAAandNSrecords, the administrator ensures they have the precise performance data needed to baseline and troubleshoot the organization's DNS health.
ThousandEyes offers several native integrations for receiving instant event notifications triggered by alerts. Which of the following integrations are available directly within the ThousandEyes platform? Select all that apply.
Options:
ServiceNow
PagerDuty
MS Teams
Splunk
AWS
AppDynamics
Webex
Answer:
A, B, C, D, F, G, HExplanation:
According to theDesigning and Implementing Enterprise Network Assurance (300-445 ENNA)architecture, ThousandEyes provides a suite of native, "out-of-the-box" integrations specifically designed foralert notifications. These integrations are configured via theManage > IntegrationsorAlert Rules > Notificationstabs and allow the platform to push instant event data to a variety of collaboration, IT operations, and observability tools.
The verified list of native notification integrations includes:
ServiceNow (A):Facilitates direct incident management and automated ticketing workflows.
PagerDuty (B):Allows for automated incident escalation and on-call routing based on ThousandEyes alerts.
MS Teams (C) & Slack (H):Enable real-time chatops by pushing alert details and permalinks directly into specified channels for team collaboration.
Splunk (D):Utilizes theCisco ThousandEyes App for Splunkto ingest alert data for historical analysis and correlation within a SIEM or logging platform.
AppDynamics (F):Sends alert notifications directly into an AppDynamics instance, allowing application owners to correlate network issues with APM metrics.12
Webex (G):Integrates with theWebex Control Huband specific Webex spaces to provide unified visibility for collaboration performance.34
AWS (Option E)is not a nativealert notificationdestination5in this context; instead, ThousandEyes integrates with AWS for "Cloud Insights" (ingesting VPC Flow Logs) and "Test Recommendations" rather than acting as a receiver for event notifications like a chat or ITSM tool. By utilizing these native integrations, enterprise teams ensure that the right stakeholders are notified through their preferred communication channels the moment a performance threshold is breached, drastically improving response times across the organization.
What is a primary advantage of passive monitoring over active monitoring?
Options:
Passive monitoring can measure the network's performance under synthetic conditions.
Passive monitoring can provide real-time data on network performance without adding traffic to the network.4
Passive monitoring allows for the generation of test traffic to simulate user behavior.
Passive monitoring can directly measure the performance of specific network services or protocols.
Answer:
BExplanation:
In theDesigning and Implementing Enterprise Network Assurance (300-445 ENNA)architecture, a critical design consideration is the impact of the monitoring solution on the production environment. The primary advantage ofpassive monitoring(Option B) is its non-intrusive nature; it provides insights into network performance and traffic composition without injecting additional "synthetic" overhead into the data plane.
Passive techniques—such asCisco Meraki Insight (MI), NetFlow, and SNMP—rely on the telemetry generated by existing user traffic or the device's own control plane. For example, Meraki Insight analyzes HTTP/S flows as they naturally pass through a Meraki MX appliance to derive application performance scores, rather than sending separate probes.5This ensures that the monitoring tool itself does not consume bandwidth or contribute to network congestion, which is particularly vital in bandwidth-constrained branch environments or on high-utilization links.
In contrast,active monitoring(Options A and C) requires the deliberate generation of synthetic traffic, which can potentially skew results if the volume is too high or if the network is already at capacity. While active monitoring is essential for proactive troubleshooting (measuring performance before users complain), passive monitoring is the preferred method for long-term historical analysis of real user experience and infrastructure utilization because it captures what is actually happening on the wire. Option D is a shared capability; both types can measure specific services, but only passive monitoring does so while remaining transparent to the network load. Therefore, the lack of added traffic is the definitive advantage of the passive approach.
Which of the following is an example of active monitoring in network performance management?
Options:
Analyzing SNMP data to observe interface utilization on a router
Capturing packets on a network segment to identify the top talkers
Sending a continuous ping from one office to another to measure latency
Collecting NetFlow records to analyze traffic patterns over time
Answer:
CExplanation:
Within the framework ofDesigning and Implementing Enterprise Network Assurance (300-445 ENNA), network monitoring is categorized into two primary methodologies: active and passive monitoring.1Active monitoring(Option C) is characterized by the generation of synthetic or "probes" traffic specifically designed to measure network performance.2These probes simulate real-world user activity, such as HTTP requests, DNS queries, or ICMP pings, to baseline performance metrics like latency, jitter, and packet loss.
The core benefit of the active approach is its independence from actual user traffic. By sending a continuous ping or synthetic HTTP probe, an engineer can verify path availability and performance even during off-peak hours when no real users are on the network. In the context of Cisco ThousandEyes—a central platform in the ENNA certification—this is the primary mode of operation for Cloud, Enterprise, and Endpoint agents. For instance, a ThousandEyes network test proactively sends packets to a target IP or URL to visualize the hop-by-hop underlay and overlay paths.
Conversely, options A, B, and D representpassive monitoringtechniques. Passive monitoring involves observing and analyzing traffic that is already traversing the network.3Methods such asSNMP(Option A) provide device-level health data like CPU load and interface utilization, whilepacket captures(Option B) andNetFlow(Option D) analyze the characteristics of existing user flows to determine top talkers or traffic patterns. While passive monitoring is excellent for volume and utilization analysis, it lacks the proactive capability to test a path's performance before a user encounters a failure. Therefore, sending a synthetic probe like a continuous ping is the definitive example of active monitoring.
Refer to the exhibit.
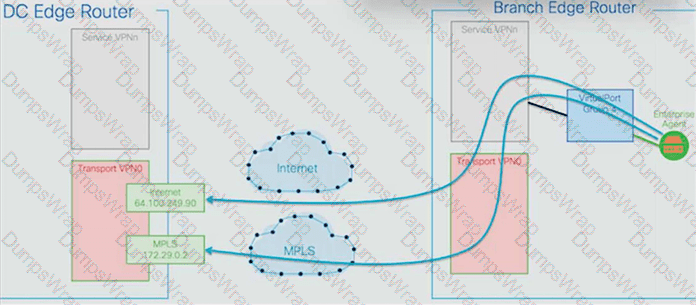
An engineer must use Cisco ThousandEyes testing to monitor their Cisco Catalyst SD-WAN fabric. Which SD-WAN component is being monitored by ThousandEyes?
Options:
underlay
IPsec tunnels
overlay
GRE tunnels
Answer:
AExplanation:
In theDesigning and Implementing Enterprise Network Assurance (300-445 ENNA)curriculum, understanding the visibility gap between the SD-WAN overlay and the transport underlay is a core competency. The provided exhibit illustrates a ThousandEyes Enterprise Agent deployed on aBranch Edge Routerperforming tests across two distinct paths:Internet(reaching a destination at 64.100.249.90) andMPLS(reaching a destination at 172.29.0.2).
According to the ENNA architecture guidelines, ThousandEyes is primarily utilized to provide hop-by-hop visibility into theunderlaynetwork. While SD-WAN controllers like vManage provide native monitoring for the overlay—the logical IPsec tunnels (Option B) that form the SD-WAN fabric—they often lack granular visibility into the physical service provider paths (the underlay) that carry those tunnels. The exhibit specifically highlights the agent probing the transport networks (Transport VPN0) directly, bypassing the overlay tunnels to measure the raw performance of the ISP and MPLS circuits.
By monitoring theunderlay(Option A), the engineer can identify if high latency or packet loss is caused by a specific hop within the service provider's infrastructure or at a peering point. This "underlay visibility" is critical for troubleshooting SD-WAN performance issues where the overlay may report a tunnel down, but the root cause lies in a BGP routing change or physical fiber cut in the provider network. ThousandEyes Enterprise Agents, natively integrated into Catalyst 8000 and ISR 4000 platforms, allow for this persistent underlay monitoring without additional hardware.
Overlay (Option C):While ThousandEyes can monitor overlay performance, the exhibit's focus on the raw IP addresses (Internet and MPLS) in the transport VPN indicates an underlay test.
IPsec/GRE Tunnels (Options B & D):These represent the transport mechanisms of the overlay. ThousandEyes probes the pathunderthese tunnels to ensure the transport health is sufficient to support the fabric.
You are investigating intermittent failures in a ThousandEyes transaction test targeting a web application that uses Basic Authentication. The failures occur randomly across different agents and times of day. What steps would you take to troubleshoot and resolve the issue? (Select all that apply)
Options:
Disable Basic Authentication in the test configuration to isolate the problem.
Verify the correctness of credentials by manually logging into the application from different locations.
Analyze the ThousandEyes waterfall charts and HTTP response codes to identify potential bottlenecks or errors.
Contact the web application vendor to report the issue and inquire about possible server-side problems.
Answer:
B, C, DExplanation:
Troubleshooting intermittent performance issues is a core component of theDesigning and Implementing Enterprise Network Assurance (300-445 ENNA)curriculum. When a transaction test using Basic Authentication fails randomly, the engineer must employ a multi-layered diagnostic approach to determine if the fault lies with the credentials, the network path, or the application server.
The first step is toverify the correctness of credentials(Option B). Because Basic Authentication encodes credentials in the header, any change in user permissions or account lockouts will trigger immediate failures. Performing manual logins from various geographical locations helps rule out location-based access control lists (ACLs) or regional IdP sync issues.
The most data-rich diagnostic step is toanalyze the ThousandEyes waterfall charts and HTTP response codes(Option C). The waterfall view allows the engineer to see if the failure happens during the initial 401 Unauthorized challenge or after the credentials are sent. If the charts show high "Wait Time" or 5xx errors, the issue is likely server-side latency or instability. If the "Connect Time" is high, the problem may be network-layer congestion.
Finally, if the telemetry indicates that the network path is healthy but the server is intermittently returning errors or timing out, the engineer shouldcontact the web application vendor(Option D). Providing the vendor with the specific ThousandEyes "Share Link" allows them to see the exact same packet-level and browser-level data, proving that the issue is not with the client's network but with the server-side infrastructure. Disabling authentication (Option A) is not a valid troubleshooting step for a test designed specifically to monitor an authenticated workflow.
What Meraki platform supports ThousandEyes?
Options:
Meraki MX (Security Appliances)
Meraki MR Series (Wireless Access Points)
Meraki MS Series (Switches)
Meraki MV (Smart Cameras)
Meraki MG (Cellular Gateways)
All of the above
Answer:
AExplanation:
According to theDesigning and Implementing Enterprise Network Assurance (300-445 ENNA)curriculum, the native integration of ThousandEyes within the Meraki portfolio is specifically focused on theMeraki MXsecurity and SD-WAN appliances. This integration allows users to install ThousandEyes Enterprise Agents directly on supported Meraki MX hardware, providing critical visibility into the performance of services that distributed users rely on.4
TheMeraki MX (Option A)supports the ThousandEyes Enterprise Agent as a containerized service that can be activated with a single click within the Meraki Dashboard.5This integration is designed to provide better monitoring and testing capabilities for customers interested in improving the quality of their experience and adding the appropriate SD-WAN policies to optimize network performance. By running the agent natively on the MX, administrators can monitor the performance of external applications and services directly from the SD-WAN sites, bridging the gap between local branch health and global internet performance.6
While Cisco continues to expand its assurance integrations across the portfolio, theMR (Wireless),MS (Switching),MV (Camera), andMG (Cellular)series do not currently support the native, "on-box" execution of the ThousandEyes Enterprise Agent. For these other platforms, visibility is typically achieved through passive monitoring viaMeraki Insight (MI)or by deploying ThousandEyes agents on connected client devices (Endpoint Agents) or nearby infrastructure. Therefore, theMeraki MXis the only verified platform supporting native ThousandEyes agent deployment in this context.
Refer to Exhibit:
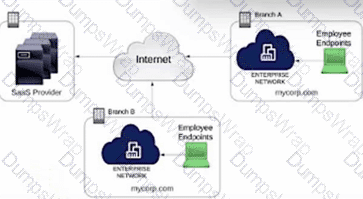
A network engineer is deploying a Cisco ThousandEyes agent to monitor the network for a SaaS application without affecting the performance of the employee endpoints. Which ThousandEyes agent must be deployed to obtain the network metrics from branch A?
Options:
Endpoint Agent
Application Agent
Enterprise Agent
Cloud Agent
Answer:
CExplanation:
In the framework ofDesigning and Implementing Enterprise Network Assurance (300-445 ENNA), selecting the appropriate ThousandEyes agent type is critical to balancing visibility requirements with infrastructure constraints. For Branch A, the primary objective is to gain network-layer metrics (such as latency, packet loss, and jitter) and path visualization for a SaaS application while strictly avoiding any performance impact on employee endpoints.
TheEnterprise Agent(Option C) is the correct choice because it is designed for "inside-out" monitoring from within the corporate network environment. These agents are lightweight software probes that can be deployed on existing network infrastructure, such asCisco Catalyst 9300/9400 switchesorCatalyst 8000 Edge Platforms, using Docker containers or virtual machines. By hosting the agent on the branch router or a dedicated local server, the engineer can execute synthetic tests to the SaaS provider's destination. This approach provides the necessary network vantage point from Branch A without requiring any software installation or resource consumption on the individual employee workstations (endpoints).
Other agent types do not satisfy the specific constraints of this scenario:
Endpoint Agentsare installed directly on user devices (Windows/macOS) to provide "last-mile" visibility. However, they use the endpoint's CPU and memory, which contradicts the requirement to not affect endpoint performance.
Cloud Agentsare maintained by Cisco in global ISP data centers. While they provide "outside-in" visibility, they cannot capture internal branch network characteristics or the specific path from Branch A's internal local area network.
Application Agentis a non-standard term and does not exist as a standalone agent type within the ThousandEyes architecture.
Therefore, deploying anEnterprise Agentwithin the branch infrastructure ensures that the network engineer obtains high-fidelity network metrics while keeping employee devices entirely unburdened.
Introduction to ThousandEyes
This video provides an essential overview of how ThousandEyes agents function within a CCNP-level enterprise network assurance strategy.
A network engineer deploys a ThousandEyes Docker agent on a switch using app-hosting. The agent needs to communicate through a proxy server, but this configuration was missed during the initial deployment. The engineer adds the proxy settings to the app-hosting configuration. What is the next step to ensure the agent uses the proxy and appears online in the ThousandEyes portal?
Options:
Restart the container using app-hosting stop appid agentname followed by app-hosting start appid agentname
Reinstall the agent using the app-hosting install command with the correct proxy settings
Execute the full agent lifecycle: app-hosting stop appid agentname, app-hosting deactivate appid agentname, app-hosting activate appid agentname, app-hosting start appid agentname
No action required; the agent will pick up the configuration automatically
Answer:
CExplanation:
In theDesigning and Implementing Enterprise Network Assurance (300-445 ENNA)implementation guide, the Cisco IOS XEApplication Hostinglifecycle is a critical concept for troubleshooting and configuration management. When an application environment variable—such as proxy settings—is modified in the app-hosting configuration, a simple restart of the container is insufficient.
The correct procedure involves moving the application back to theConfiguredstate before bringing it back toRunning. This requires a four-step lifecycle execution (Option C):
Stop:Terminates the current running instance of the container.
Deactivate:Releases the hardware resources (CPU, Memory, Virtual Interfaces) and, crucially, detaches the previous runtime configuration.
Activate:Re-allocates the resources andinjects the new configuration parameters(including the updated proxy settings) into the container's environment.
Start:Initiates the container with the newly applied configuration.
Without thedeactivate/activatesequence, the container will continue to use the environment variables present at the time of its initial activation, causing the agent to remain offline as it fails to reach the ThousandEyes portal without the proxy.Reinstalling(Option B) is an unnecessary and time-consuming step that involves re-downloading or re-copying the image, whileNo action(Option D) will result in no change to the agent's connectivity status.
An architect needs to analyze network path metrics from their internal network, specifically from the access layer to a cloud-hosted web server.1 Which ThousandEyes agent is most appropriate for this task?
Options:
Synthetic Agent
Enterprise Agent
Cloud Agent
Endpoint Agent
Answer:
BExplanation:
In the framework ofDesigning and Implementing En8terprise Network Assurance (300-445 ENNA), selecting the correct agent type depends heavily on the vantage point required for the specific observation. For this scenario, the architect must collect metrics from theinternal network access layer—the point closest to where the users or devices reside within the corporate perimeter—towards a cloud-hosted destination.
TheEnterprise Agent(Option B) is the most appropriate choice because it is specifically designed to be deployed on infrastructure owned and managed by the organization. These agents are "inside-out" vantage points that can be installed directly onCisco Catalyst 9300 or 9400 Series switchesat the access layer using Docker containers. By deploying an Enterprise Agent at the access layer, the architect gains visibility into the entire network path, starting from the internal LAN, traversing the edge/WAN, and reaching into the cloud-hosted web server. This allows for the identification of issues such as local congestion, ISP peering problems, or cloud provider latency.
Other options do not meet the criteria:
Synthetic Agent (Option A):This is a distractor term. All ThousandEyes agents (Cloud, Enterprise, and Endpoint) are synthetic agents because they all perform active synthetic testing.
Cloud Agent (Option C):These are pre-deployed by Cisco in global ISP data centers and provide an "outside-in" view.14While useful for monitoring public-facing availability, they cannot provide visibility into the internal network or the access layer of the organization.
Endpoint Agent (Option D):While these are installed on end-user machines and provide a "user-centric" view, they are generally not used for infrastructure-level path analysis from the access layer switches themselves.
Thus, theEnterprise Agentis the definitive choice for monitoring from the access layer to the cloud.
You're responsible for monitoring the performance of a company e-commerce website. You're considering using ThousandEyes Synthetic Web Tests. Which of the following functionalities of ThousandEyes Synthetic Web Tests would be MOST beneficial for monitoring the e-commerce checkout process?
Options:
HTTP server monitoring
Transaction monitoring
DNS monitoring
Routing visibility
Answer:
BExplanation:
According to theDesigning and Implementing Enterprise Network Assurance (300-445 ENNA)framework, application health is not just about reachability, but about the functionality of business-critical paths. For an e-commerce checkout process, which involves multiple interactive steps such as "Add to Cart," "Enter Shipping Info," and "Finalize Payment,"Transaction monitoring(Option B) is the most beneficial functionality.
Transaction tests provide a high-level view of application performance by executing a script that simulates a real user's interaction with the site's various components. UnlikeHTTP server monitoring(Option A), which merely verifies that a single URL returns a specific status code (like 200 OK), Transaction monitoring validates that the underlying application logic and database transactions are working as expected across the entire session. If a user can reach the homepage but the "Checkout" button fails due to a slow backend API call or a JavaScript error, only a Transaction test will identify the failure and provide a granular waterfall chart to show exactly where the process broke down.
WhileDNS monitoring(Option C) andRouting visibility(Option D) are crucial for identifying foundational connectivity issues, they are insufficient for monitoring complex transactional workflows. A DNS failure would prevent access to the site entirely, but a "broken" checkout process often occurs while the network and DNS appear perfectly healthy. Transaction monitoring bridges this gap by providing "layer 7" visibility into the end-to-end user experience, making it the definitive choice for e-commerce performance assurance.
Refer to the exhibit.
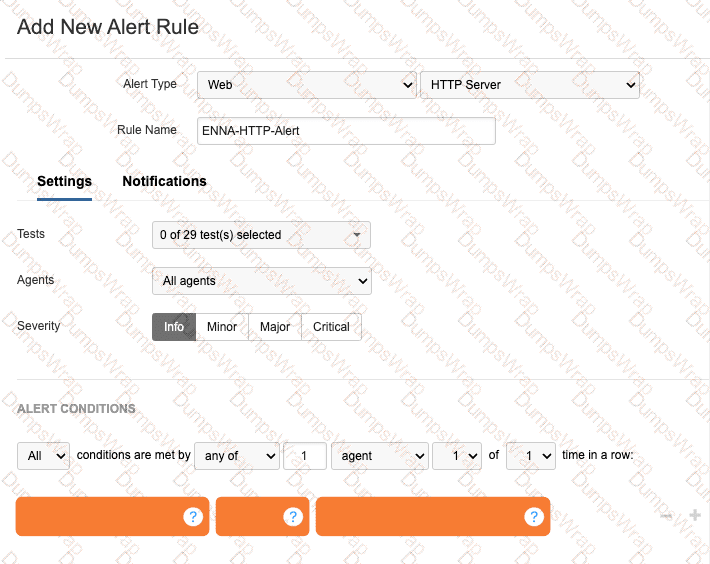
A network engineer is tasked with configuring an alert that will trigger if the HTTP server responds with a server error. What alert conditions should be configured to meet the specified requirements?
Options:
Error type is any
Wait Time is Dynamic (New) with Medium sensitivity
Response Time ≥ Static 500ms
Response Code is server error(5XX)12
Answer:
DExplanation:
56
In theDesigning and Implement7ing Enterpr8ise Network Assurance (300-445 ENNA)framework, configuring effective alert rules is critical for distinguishing between standard network noise and actionable application-layer failures. ForWeb - HTTP Servertests, ThousandEyes allows engineers to monitor both network-level metrics (like Connect time) and application-level indicators (like HTTP response codes).
The requirement is to trigger an alert specifically when the HTTP server responds with aserver error. In the HTTP protocol, server errors are categorized as the5XXseries of status codes (e.g., 500 Internal Server Error, 503 Service Unavailable, 504 Gateway Timeout). To meet this requirement, the engineer must configure a location alert condition where theMetricis set toResponse Codeand the condition value isserver error(5XX)(Option D).
Reviewing the other options:
Error type is any (Option A):While this would capture server errors, it would also trigger for 4XX client errors (like 404 Not Found) and network-layer timeouts, making it too broad for a specific "server error" requirement.
Wait Time is Dynamic (Option B):This monitors the time-to-first-byte using statistical baselining. While high wait times oftenprecede5XX errors, this condition only alerts on latency, not on the actual error code itself.
Response Time (Option C):Similar to wait time, this monitors performance speed rather than the logical success or failure of the server's response.
By specifically selectingResponse Code: server error(5XX), the engineer ensures that the operations team is only notified when the application backend is experiencing a functional failure, rather than just a slow response or a client-side misconfiguration.