Weekend Special Limited Time 65% Discount Offer - Ends in 0d 00h 00m 00s - Coupon code: dumps65

Cisco 500-420 Dumps

Page: 1 / 6
Total 64 questions

Cisco AppDynamics Associate Performance Analyst(CAAPA) Questions and Answers

Question 1

Which tab within the Application Dashboard displays performance trends for each of Snapshots, Average Response Time, and Events within one central view?

Options:

A.

Application Flow Map

B.

Dashboard

C.

Events

D.

Transaction Score

E.

Network Dashboard

Question 2

A Performance Analyst needs to send a summary report of specific events every two hours. Which feature can enable this automated report summary?

Options:

A.

Email Templates

B.

HTTP Request Templates

C.

Email Digests

D.

Email / SMS Configuration

Question 3

A Performance Analyst received an alert that the Average Response Time is increasing after a new marketing offer was released. Which metric would quickly help the Performance Analyst determine that users may not be critically impacted?

Options:

A.

Errors per Minute increase

B.

Calls per Minute decrease

C.

Errors per Minute decrease

D.

Calls per Minute increase

Question 4

What is the Node limit of the maximum Service Endpoints per node?

Options:

A.

50

B.

100

C.

250

D.

1000

Question 5

The performance impact on the_______would lead a Performance Analyst to limit the duration and frequency of automatic diagnostic sessions.

Options:

A.

Application

B.

Controller

C.

Network

D.

Operating System

Question 6

Which three data points can be located by drilling down into a JDBC exit call for an Oracle backend? (Choose three.)

Options:

A.

Query type

B.

Statement type

C.

Query Id

D.

Weight %

E.

Originating node

F.

%Time

Question 7

as

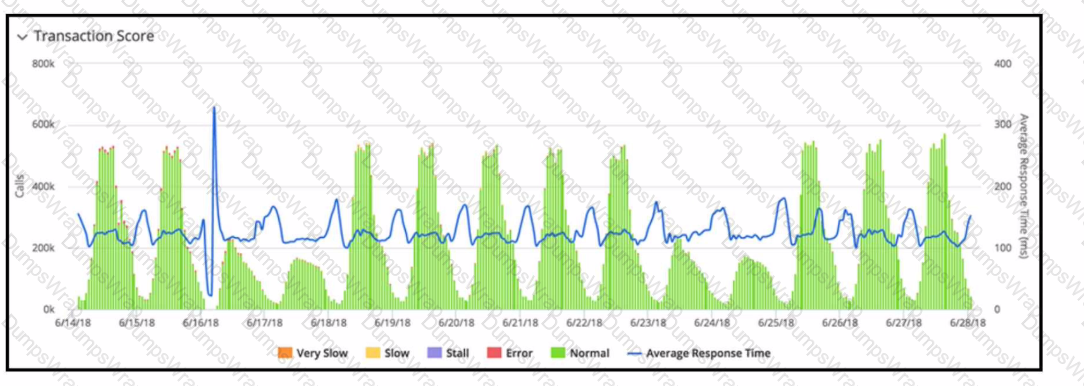
Refer to the exhibit. The transaction score in the graphic displays an interesting performance pattern outside of business hours on 6/16/18. Which additional performance anomaly should be of most interest to a Performance Analyst?

Options:

A.

Elevated Response Time at 6/19/18

B.

Elevated Response Time at 6/25/18

C.

Lower than usual volume at 6/17/18

D.

Low volume at 6/15/18

Question 8

Which three reports can be scheduled for periodic generation and delivery to email recipients? (Choose three.)

Options:

A.

Ad Hoc Data

B.

Application Health

C.

Error Trends

D.

Custom Dashboard

E.

Controller Audit

F.

Tier List

Question 9

A Business Transaction was registered and displayed on the Business Transaction Dashboard. It has continuous load on it. After an hour the Business Transaction stopped being displayed in the Business Transaction Dashboard. Which action stopped the display of the Business Transaction?

Options:

A.

The Business Transaction Lock Down was enabled an hour ago.

B.

The Business Transaction had been deleted an hour ago from the Business Transaction Dashboard.

C.

The Business Transaction Custom Match Rule was deleted an hour ago.

D.

The Business Transaction had been excluded an hour ago from the Business Transaction Dashboard.

Question 10

What does the Live Preview option in a Business Transaction Discovery Session allow a user to do?

Options:

A.

See if new Transaction Discovery Rules work

B.

Provide streaming logs from the application agent

C.

Search classes and methods currently running on the system

D.

Stream entry points in your application

Question 11

A Performance Analyst has enabled Development Level Monitoring for an application. For a default configuration, in which scenario will Development Level Monitoring get automatically disabled?

Options:

A.

A maximum of 500 calls per minute limit is exceeded, and Maximum heap utilization percentage goes above 90%

B.

A maximum of 1500 calls per minute limit is exceeded, and Maximum heap utilization percentage goes above 90%

C.

A maximum of 1000 calls per minute limit is exceeded, and Maximum heap utilization percentage goes above 95%

D.

A maximum of 2000 calls per minute limit is exceeded, and Maximum heap utilization percentage goes above 95%

Question 12

Which two types of data are collected by Information Points? (Choose two.)

Options:

A.

Troubleshooting Metric Data

B.

Business Metric Data

C.

Code Metric Data

D.

Analytics Metric Data

Question 13

Which type of Data Collector will capture code data such as method arguments, variables, and return values?

Options:

A.

Method Invocation Data Collector

B.

Servlet Container Collector

C.

Transaction Data Collector

D.

URI Data Collector

Question 14

What are two types of Data CollectorsinAppDynamics APM? (Choose two.)

Options:

A.

SQL data collectors

B.

HTTP data collectors

C.

Remote Service invocation data collectors

D.

Method invocation data collectors

Question 15

Within the configuration setting for Slow Transactions, under the "Configure Diagnostic Session Duration and Collection Rate" option, what is the default value pair for the setting "Collect up to ____snapshots per minute for _____ minutes"?

Options:

A.

2,2

B.

5,5

C.

10, 10

D.

4,4

Question 16

A Performance Analyst has opened a database collector view. Which tab should be clicked on next to find slow queries?

Options:

A.

Schemas

B.

Queries

C.

Live View

D.

Object Browser

Question 17

Which two statements are correct about creating Information Points? (Choose two.)

Options:

A.

A wildcard can be used to select multiple methods for an Information Point.

B.

A wildcard can be used to select multiple classes for an Information Point.

C.

An Information Point can be created on the same class and method as a Custom Exit Point.

D.

An Information Point can be created on a class and method that is executed before the Business Transaction entry point.

Question 18

as

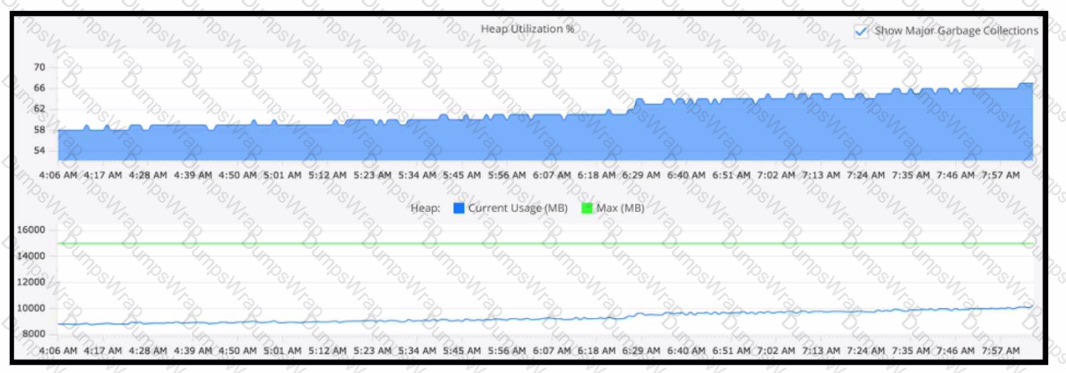
Refer to the exhibit. Using this heap utilization graph, which method is used to confirm if a memory leak is occurring during a certain time frame?

Options:

A.

In metric browser go through Application Infrastructure > Hardware Resources and select Memory Total (MB) and Used (MB)

B.

Refer to the Tiers and Nodes section and into the Memory tab and visualize Heap Utilization (%) and Heap Current Usage (MB) Vs Max (MB)

C.

Refer to the Tiers and Nodes section and into the JMX tab and select JVM > Memory > Heap > Max Available (MB) and Current usage (MB)

D.

In metric browser go through Application Infrastructure > Hardware Resources > Memory Total (MB) and Swap Used (MB)

Question 19

Which three Key Performance Indicators (KPIs) are automatically collected when you create an Information Point without adding custom data? (Choose three.)

Options:

A.

Maximum Response Time

B.

CPU Time

C.

Minimum Response Time

D.

Response Time

E.

Errors per Minute

F.

Calls per Minute

Page: 1 / 6
Total 64 questions