
Epic Cogito Fundamentals Questions and Answers
What must be true before you can share a SlicerDicer session with another user?
Options:
The other user must be logged into the same workstation
The other user must have access to the same data model
The session must be exported as a file
The measure must be filtered
Answer:
BExplanation:
Before a session can be shared with another user, the recipient must have access to the same data model. The session is built on a model, and a user who cannot see that model cannot open the session in a meaningful way, because the underlying data is protected by security. This is the second option. The recipient does not need to be logged into the same workstation, as sharing is a function of the application and is independent of the physical device. Exporting the session as a file is not required, since sharing takes place within the application and the recipient receives a live, read-only version. The measure does not have to be filtered, because measures and filters are independent elements of the session. If the recipient lacks access, the practical solution is to request the necessary security class, or to share the underlying results in another form, such as an exported file, which does not carry the same interactive capabilities. Verifying access before sharing prevents confusion, particularly when working with colleagues in other departments whose security profiles differ.
A user ran a report to list all geriatric patients. They now want to see only those who have arthritis. How can they do this without re-running the report?
Options:
Add a new summary level
Use the Filters tab and filter the " Medical Problem " column
Export to Excel and filter there
Create a new metric
Answer:
BExplanation:
When a report has already been run and the user wants to narrow the results, the Filters tab of the Results Viewer is the efficient route. The user selects the Medical Problem column and applies a value of arthritis, and the displayed results are reduced to the geriatric patients who have that problem, without the report being executed again. That makes the second option correct. Adding a summary level is a Radar metric concept and does not filter report results. Exporting to Excel and filtering there would work but is manual, takes the data out of the application and is unnecessary when the viewer provides the function. Creating a new metric is far more than the situation requires. The distinction between the criteria and the column filters is important. The criteria determine which records the search returns and require the report to be run again if they change, whereas column filters only affect what is displayed from the existing result set. When a user needs a different population, the criteria should be edited, but when the existing results only need refinement, a filter is sufficient.
A SlicerDicer session in a dashboard component shows outdated data. The session uses Caboodle. What should be done?
Options:
Increase ETL process frequency to update Caboodle.
Switch to Chronicles for real-time data.
Rebuild the session with new filters in Hyperspace.
Assign a new Report Group to the component.
Answer:
AExplanation:
Warehouse-based content depends on the extract and load cycle. If a component shows data that is out of date or missing recent records, the first place to look is how often Caboodle is refreshed. The recommended solution here is: increase ETL process frequency to update Caboodle. The reason is straightforward. SlicerDicer queries Caboodle, Caboodle is populated from Clarity, and Clarity is populated from Chronicles, so each stage adds time between a clinical event and its visibility. Rebuilding the session, assigning report groups or editing filters does not shorten that chain, and a switch to real-time Chronicles data is not how this tool works. Before requesting a change, the developer should verify that the loads are completing, because a failed job produces the same symptom as an infrequent one. After the schedule is adjusted, the component should be checked again against a trusted source for the most recent day, to confirm that the gap has closed and that no records are still absent.
A Cogito SQL report, sourced from Clarity, groups patient encounters by diagnosis code and calculates multiple summary metrics (e.g., count, average cost). The report requires a trace log and must be restricted to financial analysts. Which steps ensure the report is correctly configured?
Options:
Use Clarity, define grouping in the Display tab, enable trace logging, and assign a Report Group for financial analysts.
Build in Chronicles, configure summary targets, disable ad hoc searches, and set security points.
Create in SlicerDicer, add diagnosis code slices, enable trace logging, and restrict via Action Groups.
Use Caboodle, assign user roles in Hyperspace, and configure Threshold Overrides.
Answer:
AExplanation:
When a report must aggregate Clarity data, record its execution and restrict its audience, the configuration has several parts that work together. The scenario is resolved by this: use Clarity, define grouping in the Display tab, enable trace logging, and assign a Report Group for financial analysts. Clarity is the proper source for SQL reporting on historical data, grouping and functions are defined in the Display tab, and trace logging provides an audit trail that is particularly valuable where the report concerns sensitive operational information. The report group keeps the report within its intended audience. Alternatives based on Chronicles, SlicerDicer or Caboodle either change the platform or combine unrelated settings. After building the report, the developer should schedule it to avoid peak extract times, validate the figures and confirm that a user outside the group cannot find or run it. It is good practice to record the cause and the correction in the component or report description, so that colleagues who meet the same symptom later can resolve it quickly without repeating the investigation.
A Reporting Workbench report, sourced from Chronicles, fails to execute for some users due to a custom filter for high-risk surgical patients, despite including a trace log and being Ready for Use. The report groups data by surgeon and calculates complication rates. What is the issue, and how should it be resolved?
Options:
Users lack access to the custom filter ' s security class; update their security settings to include the filter ' s permissions.
The report ' s data source is misconfigured for Clarity; switch to Chronicles and verify the filter.
The surgical filter is not enabled in SlicerDicer; rebuild the filter in Hyperspace.
The report ' s Report Group is misaligned; update the Access form to include the surgical team.
Answer:
AExplanation:
When failures are limited to certain users, the investigation should focus on the permissions that distinguish them. The scenario is resolved by this: users lack access to the custom filter ' s security class; update their security settings to include the filter ' s permissions. The custom filter belongs to the report ' s design, and its security class determines who may use it, so a person without the class cannot run the report even though it is ready for use and logging is active. The data source and the report group were not the cause, because the report works for others. The developer should identify the class, discuss the request with the content owner and, once it is approved, ask for the class to be assigned. It is helpful to document the filters that carry restrictions, so that new users can be provisioned correctly from the start. Before release, the developer should retest the change with an account that has the same security as the intended audience, because a result that looks correct for a developer can still fail for a typical user.
A dashboard component with a Hyperspace activity link fails to open the Case Review activity for non-admin users, despite a valid activity descriptor and Dashboard Resources as the data source. Admins can access the link, and the dashboard is enabled. What is the cause, and how should it be fixed?
Options:
Non-admin users lack security points for the Case Review activity; update their security class to include the necessary permissions.
The component ' s data source is misaligned with the SlicerDicer session; align the data source with Caboodle.
The dashboard ' s Layout form restricts non-admin interactivity; enable interactivity for all users.
The activity descriptor is not registered in the Chronicles master file; register the descriptor.
Answer:
AExplanation:
The pattern here, success for some users and failure for others, directs attention to permissions. The correct diagnosis and remedy is: non-admin users lack security points for the Case Review activity; update their security class to include the necessary permissions. The component has the right descriptor and data source, so it is configured correctly, but the destination activity has its own security requirement, and the dashboard cannot override it. Changing the data source, relaxing the layout or re-registering the descriptor would not help users who lack authorization. The developer should confirm the missing points by comparing security classes, discuss the request with the owner of the activity and, once approved, have the administrator update the class. Afterward the link should be tested again with an affected user. Because the failure message is often unhelpful, a short note beside the component that names the role needed can save users and the analytics team from avoidable confusion.
Which action opens the Item Information window in Hyperspace?
Options:
CTRL + Left-click on the field
F12 and select Item Info
Right-click and choose View Item
Shift + F2
Answer:
AExplanation:
The action that opens the Item Information window in Hyperspace is holding the Control key and left-clicking on the field. The window displays the master file, the item number and a description for the field, and it allows the analyst to identify the Chronicles item behind what appears on the screen. The first option is correct. The F12 function key does not open an item information option. Right-clicking to choose a View Item command is not the method, and Shift and F2 is not associated with this function. The technique is a standard first step when researching a requirement. After the item has been identified, the Data Dictionary can be searched by the INI and item number to find the Clarity table and column that store it, and the Item Editor can be used to confirm the properties of the item. The availability of the window can depend on the user ' s security, and a user who does not see the information should have their access reviewed by the security team.
You are reviewing a Clarity table and find a column that meets your needs, but it is deprecated. In the table ' s Data Dictionary entry, where can you look to find any references to an alternative?
Select one of the following (1 PT)
Options:
Find a column that extracts the same Chronicles information
The Dependencies section
The Category Lookup column
The deprecated column ' s description
Answer:
DExplanation:
When Epic deprecates a column, the explanation and any replacement guidance are documented where analysts read about each column: its description. The description is expected to state that the column is deprecated and to direct the reader to the preferred column or table, so it is the first and most reliable place to look. The Dependencies section serves a different purpose. It lists objects that depend on the table or that the table depends on, such as views and related tables, and it is not a record of replacement guidance for individual columns. The Category Lookup column identifies the ZC_ table associated with a category column and has no bearing on deprecation. Searching for another column that extracts the same Chronicles information is a possible fallback, but it is a manual investigation rather than a documented reference and may lead to a column with different semantics or granularity. Reading the description first avoids that risk and respects the intent of the data model owners. Following the guidance also protects reports from future breakage, since replacements are the columns Epic intends to maintain. The Data Dictionary therefore remains the single source for both identifying and resolving deprecation.
A dashboard component fails to open a linked Hyperspace activity for some users, despite a valid activity descriptor and Dashboard Resources as the data source. What is the cause?
Options:
The users lack security points for the Hyperspace activity in their security class.
The component ' s data source is misaligned with the SlicerDicer session.
The dashboard ' s Layout form restricts interactivity.
The activity descriptor is not enabled in Chronicles.
Answer:
AExplanation:
When a Hyperspace link behaves differently for different users, the difference almost always comes from security. The solution to this scenario is: the users lack security points for the Hyperspace activity in their security class. The component ' s own configuration is valid, as shown by the fact that it works for some people. What differs is the user, and the activity opened by the link is protected by points that must be present in the user ' s class. Options that propose a different data source, a layout restriction or an unregistered descriptor would affect everyone equally. The recommended steps are to compare a working user with a failing one, to identify the missing points and to arrange the change through the security administrator. The organization should also confirm that granting the points is appropriate, because the activity may expose sensitive information that the user does not need for their role. The analyst should also tell the requester what was changed and when the correction takes effect, since users often assume that a repair is immediate when some changes appear only after the next load or a new sign-in.
What is the fastest way to create a new dashboard?
Options:
Dashboard Options > Create Dashboard
Use Template manager
Copy an existing dashboard and modify
Build from scratch in Chronicles
Answer:
CExplanation:
The fastest way to create a new dashboard is usually to copy an existing dashboard and modify it. The copy begins with the layout, components, parameters and access settings of the original, so the developer needs only to change what differs, which is much quicker than defining every form from the beginning. The third option is correct. Using a menu path such as Dashboard Options and Create Dashboard is not the route described for source dashboards. The Template Manager is for Reporting Workbench templates and has no role in dashboards. Building from scratch in Chronicles is not how developers create dashboards, since the Dashboard Editor provides the forms for the purpose. Copying also promotes consistency, because dashboards derived from one another share design conventions. The developer should rename the copy and review each form, especially Content and Access, so that the new dashboard does not inadvertently inherit settings that are inappropriate. It must also be marked ready for use and enabled for user selection before users can see it, which is a step that is easily overlooked.
In the Epic Component Editor - Dashboard View, which of the following are valid component record types that can be selected via Chart Search?
Options:
Graph, Link, Message Board, Native HTML, Report Listing, Table
Audit Log, Scheduler, Print Queue, Form Designer
Login Tracker, Access Control, Task Manager, Summary Sheet
Script Builder, Event Timeline, Patient Journal, Code Set List
Answer:
AExplanation:
In the Component Editor, a new component record is created by selecting a component type, and the type determines which forms and settings are available. The valid types in the first option are Graph, Link, Message Board, Native HTML, Report Listing and Table. Each supports a distinct purpose. A graph presents a visualization, and a table presents rows and columns of data. A link provides a shortcut that opens an activity, report or other content. A message board lets a dashboard owner communicate information to its audience. Native HTML permits custom content to be displayed, and a report listing presents a list of reports for the user to open. The remaining options contain names that are not component types in Radar. Items such as Audit Log, Scheduler, Print Queue, Form Designer, Script Builder and Patient Journal belong to other applications or are invented, and none of them appears in the type selection. Recognizing the standard types helps the analyst choose the right component for a requirement before spending time on configuration, since the type cannot simply be changed afterward without rebuilding.
A hospital needs to benchmark its readmission rates against Epic community data in a Radar dashboard, with drill-down to patient records. Which configuration achieves this?
Options:
Use Dashboard Metrics with Epic ' s benchmarking database and a Hyperspace activity link.
Create a SlicerDicer session with a benchmarking filter and enable drill-down.
Build a Reporting Workbench report with community benchmarking and link to the dashboard.
Configure the Analytics Catalog to query Epic ' s Clarity database with drill-down.
Answer:
AExplanation:
Community comparison is delivered through dashboard metrics. The correct answer to this scenario is: use Dashboard Metrics with Epic ' s benchmarking database and a Hyperspace activity link. A metric defined in the framework can be matched with the same measure elsewhere, and the component retrieves the community figure from Epic ' s database. Alternatives based on sessions, reports or the catalog cannot access that source. The remaining features described in the requirement are ordinary component settings: an activity link supports drill-down, threshold rules support color-coded status, and export is enabled in the component ' s settings. The developer should test each feature with an authorized user, since links and exports depend on the user ' s security, and should confirm that the local definition matches the community ' s, so that the comparison is fair. It is good practice to record the cause and the correction in the component or report description, so that colleagues who meet the same symptom later can resolve it quickly without repeating the investigation.
How do you create a SlicerDicer population?
Options:
Open Radar and select " Link Component "
Use the Component Editor and add Data Source = Caboodle
Choose a data model, apply filters, and criteria to define your population
Use Chart Search and access User Security
Answer:
CExplanation:
Creating a population in SlicerDicer is a self-service process carried out in the SlicerDicer activity. The user chooses a data model to establish the subject and granularity of the analysis, selects a base, and then applies filters and criteria to narrow the group to the population of interest. The third option describes this sequence. Opening Radar and selecting a link component is a way to build a shortcut on a dashboard and does not create a population. Using the Component Editor with a Caboodle data source is a developer task for building a dashboard component, which could later display a session but does not define one. Chart Search and user security relate to launching activities and granting access, not to building a population. Once the population exists, the user adds slices and chooses a measure and a visualization, then may save or share the session. Following the sequence in order avoids common mistakes, such as choosing the wrong data model after criteria have been entered, which would require starting again because the model fixes the granularity of the results.
What does the Access form control?
Options:
Controls the set of users that can access this dashboard and lists the dashboard ' s type(s).
Layout
Components
Data sources
Answer:
AExplanation:
The Access form controls the set of users who can access a dashboard and lists the dashboard ' s types. It connects the dashboard to the report groups and user types that determine who may open it, and it records how the dashboard is classified so that it can be offered in the appropriate places. The first option is correct. Layout is set on the Layout form, components on the Content form, and data sources belong to the components themselves. Because access is defined here, the Access form is the first place to look when a user reports that they cannot see a dashboard that they expect to have. The developer should confirm that the user belongs to a group listed on the form and that the dashboard is marked as ready for use. The form also reflects the guiding principle that every user in the audience must have the security to use every component, so changes to it should be coordinated with the component settings. Testing with a user of the intended type confirms the result.
What is the purpose of expanding the " Show Additional Details " section in the Report Repository?
Options:
To request access to a dashboard
To view specific or technical information about the content
To change the template layout
To run the report immediately
Answer:
BExplanation:
Expanding the Show Additional Details section in the Report Repository lets the user view specific or technical information about the content. A summary is displayed by default, and the additional details provide what a developer needs when evaluating an item, such as technical specifications and information that is relevant to implementing it. The second option is correct. Requesting access to a dashboard is not what the section does, since the Repository is a reference and not an access-request tool. Changing the template layout is a development task carried out in the appropriate editor. Running the report immediately is not possible from the Repository, because it catalogs content but does not execute it. Reviewing the details before adopting content is good practice. It allows the developer to see whether the content depends on particular data or configuration, whether it matches the organization ' s needs and how much work would be required to implement it. The review reduces the risk of adopting something that does not fit, and it supports planning of the effort involved in adapting released content.
Which statement best describes a Record in Chronicles?
Options:
A timestamp of an event
A field within a table
A single entity within a master file, such as one patient
A report created by a user
Answer:
CExplanation:
A record in Chronicles is a single entity within a master file. In the patient master file a record represents one patient, and in the user master file a record represents one user. Each record has a unique identifier within its master file, and it contains the items that describe that entity, some stored once and others stored on contacts that represent points in time. The third option states this correctly. A timestamp of an event is a value stored in an item or the date of a contact and not a record. A field within a table is a relational concept that corresponds to a Clarity column and not to a Chronicles record. A report created by a user is an analytic object. The distinction between a record and a contact is important, because the record represents the entity as a whole while the contact represents the entity at a moment. A patient who is seen twice is still one record, with two encounter contacts, and this is why record-level data such as a birth date is stored only once.
A dashboard component must display real-time patient discharge data with a link to the Discharge Planning activity and dynamic thresholds based on discharge destination and patient age. Which data source and configuration ensure this complex functionality?
Options:
Chronicles; configure real-time extraction, a Hyperspace activity link, and Destination-Age Dynamic Thresholds in the Component Editor.
Caboodle; schedule frequent ETL processes, enable summary targets, and add destination-based filters.
Clarity; set aggregated data, link to a SlicerDicer session, and configure threshold overrides.
SlicerDicer; add a real-time discharge filter, configure Action Groups, and enable dynamic thresholds.
Answer:
AExplanation:
Data that must reflect the present moment cannot come from a warehouse that is refreshed on a schedule. For this requirement the correct choice is: chronicles; configure real-time extraction, a Hyperspace activity link, and Destination-Age Dynamic Thresholds in the Component Editor. Chronicles is the operational database, so real-time extraction settings allow the component to show current activity, and a Hyperspace activity link takes the user from the figure to the action that needs to be taken. Caboodle and Clarity are updated by ETL and are therefore a day behind, while a SlicerDicer filter cannot make a warehouse-based session current. The developer should keep the component light, since queries against the operational system must not burden clinical users, and should limit the data to what is needed for the immediate task. Any dynamic thresholds named in the answer are configured in the Output Format form and should be tested with values on each side of the limits.
What is an Item in Epic Chronicles?
Options:
A batch of exported patient records
A dashboard component used in Radar
An item stores individual data within a record or contact
A data model visualization field
Answer:
CExplanation:
An item is the unit that stores an individual data point within a record or contact. Examples include a patient ' s birth date, a department name or an order status. Each item has a number within its master file and is defined by properties, such as its data type, add type and response type. The third option describes this accurately. A batch of exported patient records is not an item, since an export may involve many records and items. A dashboard component used in Radar is part of the analytics presentation layer and is unrelated to the Chronicles structure. A data model visualization field belongs to SlicerDicer and does not describe how information is stored in the operational database. The item is also the link between Chronicles and Clarity. The Data Dictionary identifies the source of each Clarity column by the master file and item number, so analysts who understand items can trace a value from a report back to where it is entered in the operational system. The Item Editor is used to review an item ' s definition.
A dashboard component linked to a Hyperspace activity fails to open the activity for non-admin users, despite a valid activity descriptor in the Parameters field. The component uses Dashboard Resources. What is the likely cause?
Options:
Non-admin users lack the necessary security points for the Hyperspace activity.
The component ' s data source is misaligned with the SlicerDicer session.
The dashboard ' s Layout form restricts non-admin interaction.
The activity descriptor is not registered in the Analytics Catalog.
Answer:
AExplanation:
Drill-down links join a dashboard to the rest of Hyperspace, and they inherit Hyperspace ' s security rules. Where the link fails for standard users, the answer is: non-admin users lack the necessary security points for the Hyperspace activity. Administrators typically hold broad security, which is why the link seems fine in testing. Standard users have narrower classes, and if the target activity is not among them the launch is refused, whatever the quality of the component. Alternatives that adjust the data source, layout or descriptor registration do not match the pattern of failure, which depends on the user and not on the component. The best practice is to test every component with a user of each type who will use the dashboard, and Proxy Mode can assist. If a user needs the drill-down, the missing points should be requested through the normal approval process, with a clear business reason, since opening a patient-level activity carries privacy implications.
What is required before a user can see a SlicerDicer data model?
Options:
Radar configuration
Access to the SlicerDicer tab in Dashboard Editor
Security class assignment granting access to the model
A session shared by an admin
Answer:
CExplanation:
Before a user can see a SlicerDicer data model, they must have a security class that grants access to it. Each model is protected so that people see only the subjects relevant to their role, and administrators give access by assigning the appropriate class to the user or their role. This is the third option. Radar configuration is a separate framework for building dashboards and has no bearing on which models a user can view. There is no SlicerDicer tab in the Dashboard Editor that controls model access; the Dashboard Editor is used to build dashboards and not to administer analytic tools. A session shared by an administrator would let a user open that specific session, but it does not provide access to the data model in general, and the recipient would still need the underlying access to see results. The principle that access depends on security classes applies across the Cogito applications. When a user cannot find a model, the administrator ' s first step is to compare their classes with those of a colleague who can see it and to request the missing class through the usual approval process.
Which action enables a component to be visible for other users?
Options:
Check " Enable for Link Tracking "
Add to the Report Queue
Check " Ready for Use " and " Enabled for User Selection "
Include in the Caboodle filter
Answer:
CExplanation:
For a component to be visible and usable by other users, two settings on the component record must be in place. Ready for Use marks the record as complete and approved for use, so that the application will use it, and without it the component is not offered anywhere. Enabled for User Selection allows users to choose the component when they personalize their dashboards, such as by selecting Add Component. Checking both makes the component available, which is the third option. The first option refers to a link tracking setting that does not control availability. Adding a component to the Report Queue is unrelated, because the Report Queue deals with report processing. The Caboodle filter is not a component availability setting, and including a component in such a filter would not make it visible. After setting both, a developer must still ensure that the intended users have access, which is handled by the Access form and report groups, since a user cannot select content that has not been distributed to them. Reviewing the three layers of readiness, selection and distribution resolves most reports of missing components.
A hospital needs to benchmark its surgical wait times against Epic community data in a Radar dashboard, with drill-down to case details, dynamic thresholds based on procedure complexity, and export to external systems. Which configuration achieves this complex requirement?
Options:
Use Dashboard Metrics with Epic ' s benchmarking database, configure a Hyperspace activity link, enable Complexity-Based Dynamic Thresholds, and add export in Component Settings.
Create a SlicerDicer session with a benchmarking filter, enable drill-down, add complexity-based slices, and enable export in SlicerDicer.
Build a Reporting Workbench report with community benchmarking, link to the dashboard, configure complexity-based targets, and enable export.
Configure the Analytics Catalog to query Epic ' s Clarity database with drill-down, complexity filters, and export functionality.
Answer:
AExplanation:
A benchmark requires a metric that is defined consistently across organizations. The scenario is addressed by the following: use Dashboard Metrics with Epic ' s benchmarking database, configure a Hyperspace activity link, enable Complexity-Based Dynamic Thresholds, and add export in Component Settings. The metric framework stores the definitions that allow comparison, and the component is pointed at the benchmarking database to retrieve the community values. Other tools lack this capability. A session can display local data in many ways but has no community source, and Reporting Workbench has no benchmarking setting. The developer should check the definition of the measure against the community version, make sure that the data is contributed and then configure the component, including any drill-down, thresholds or export that the requirement lists. After release, the figures should be validated, since a mismatch in logic can create a misleading gap between local and community results. It is good practice to record the cause and the correction in the component or report description, so that colleagues who meet the same symptom later can resolve it quickly without repeating the investigation.
A SlicerDicer session in a dashboard component shows incomplete data for hospital readmissions. The session uses the Encounters data model. What could resolve this issue?
Options:
Schedule regular ETL processes to update Caboodle.
Switch the data source to real-time Chronicles data.
Rebuild the session in Hyperspace with new filters.
Assign a new Report Group to the component.
Answer:
AExplanation:
A SlicerDicer session that shows incomplete data for hospital readmissions, and that is based on the Encounters data model, draws its information from Caboodle. If records are missing, the likely cause is that the warehouse has not been refreshed with the most recent encounters, so the remedy is to schedule regular ETL processes to update Caboodle. The first option is correct. Switching to real-time Chronicles data is not possible for SlicerDicer, which reads from the warehouse. Rebuilding the session with new filters would not supply rows that have not been loaded. Assigning a new report group controls who sees the component and has no effect on completeness. The developer should confirm the load schedule with the Caboodle administrator and check the logs for failed or partial runs. Readmission analysis also needs a sufficient look-back and look-forward period, because a readmission cannot be counted until the later encounter exists, so recent discharges may appear to have lower rates until the data matures. Users should be told this limitation so that they interpret the latest period with care.
What is a Record in Chronicles?
Options:
A file used for personalization
Information about a unique entity in a master file
A code stored in Radar
A user security access level
Answer:
BExplanation:
A record in Chronicles contains information about a unique entity within a master file. In the patient master file, one record corresponds to one patient, while in the user master file, one record corresponds to one user. The record is identified by a unique identifier, and the details of the entity are held in items, some stored on the record itself and others on its contacts. The second option correctly describes this. A file used for personalization does not define a record, although personalization records themselves are records in a master file. A code stored in Radar is a configuration object. A user security access level is a property that may be stored in a record, though it is not the definition of a record. Understanding the record is the basis for understanding the keys of Clarity tables. A table whose primary key is a record identifier holds data that is stored once for each entity, while a table that adds a contact serial number or a line number holds data that is stored at a finer level of detail. The Record Viewer displays the contents of a record.
What is the description used for?
Options:
End users may read this description about the dashboard in the Analytics Catalog.
Internal only
Not used
For security
Answer:
AExplanation:
The description of a dashboard is text that end users can read in the Analytics Catalog. It explains what the dashboard shows, who it is intended for and when it is useful, so that people can decide whether to open it without having to try several dashboards. The first option is correct. It is not for internal use only, it is used, and it has no security function. A strong description complements the display title by supplying detail that a short title cannot. It may mention the main measures, the population covered and any important limitations, for example that the data is updated nightly. Because the catalog is searchable, relevant terms in the description also help users to find the dashboard when they search by topic. The developer should write it for a user who is unfamiliar with the build, avoiding technical shorthand, and should update it when the content changes. An accurate description reduces the number of questions sent to the analytics team.
Which of the following is NOT a valid structural component of Chronicles?
Options:
Items
Contacts
Records
Tables
Answer:
DExplanation:
Items, contacts and records are all structural components of Chronicles. A master file contains records, a record may have contacts and the data is stored in items. Tables are not part of this hierarchy. A table is a relational concept belonging to databases such as Clarity and Caboodle, where data is organized into rows and columns. Chronicles is hierarchical and stores data in the structures described, and its data is converted into tables only when it is extracted to Clarity. This is why the fourth option is the one that is not a valid structural component. The distinction is useful for avoiding a common confusion between the operational and reporting worlds. Terms such as table, column and primary key belong to Clarity and Caboodle, while master file, record, contact, item and line belong to Chronicles. The Data Dictionary bridges the two vocabularies by showing, for each Clarity column, the master file and item that supply its data, and the add type and response type of the items determine the primary key of the resulting table.
Which of the following can be found in the Report Repository? Select all that apply
Options:
Epic-released reports
Epic-released dashboards
Data models and filters
SQL queries for Caboodle
Answer:
A, B, CExplanation:
The Report Repository contains the analytics content that Epic releases to customers. This includes Epic-released reports and Epic-released dashboards, as well as data models and filters, so the first, second and third options are correct. It does not contain SQL queries for Caboodle, which are written and maintained locally by an organization ' s developers or delivered through the warehouse ' s own documentation, and the Repository is a catalog of released content and not a store of custom code. The content can be searched by keyword and reviewed before an organization decides whether to adopt it. Each item provides a summary and additional details, such as the technical information that a developer needs to evaluate it. The Repository helps an organization to avoid duplicated effort, because it can see what Epic has already built. It also supports consistency across the Epic community, since organizations that adopt the same content are measuring and reporting in the same way. Analysts should check it before building something new, and should record which released items they have implemented.
A hospital needs to benchmark its patient satisfaction scores against Epic community data in a Radar dashboard, with drill-down to survey details. Which configuration achieves this?
Options:
Use Dashboard Metrics with Epic ' s benchmarking database and a Hyperspace activity link.
Create a SlicerDicer session with a benchmarking filter and enable drill-down.
Build a Reporting Workbench report with community benchmarking and link to the dashboard.
Configure the Analytics Catalog to query Epic ' s Clarity database with drill-down.
Answer:
AExplanation:
A benchmark requires a metric that is defined consistently across organizations. The scenario is addressed by the following: use Dashboard Metrics with Epic ' s benchmarking database and a Hyperspace activity link. The metric framework stores the definitions that allow comparison, and the component is pointed at the benchmarking database to retrieve the community values. Other tools lack this capability. A session can display local data in many ways but has no community source, and Reporting Workbench has no benchmarking setting. The developer should check the definition of the measure against the community version, make sure that the data is contributed and then configure the component, including any drill-down, thresholds or export that the requirement lists. After release, the figures should be validated, since a mismatch in logic can create a misleading gap between local and community results. After the correction, a comparison with an independent source, such as an operational list or a known total, confirms that the output is complete and that no secondary problem remains hidden behind the first.
A SlicerDicer session in a dashboard component, using the Admissions data model, returns no data despite correct filters and an enabled dashboard. The session is linked to Caboodle, and some users report no visibility or drill-down capability. What are the causes, and how should they be addressed?
Options:
The data is not extracted to Caboodle, and users lack Report Group or activity link security points; schedule ETL processes, update the Access form, and configure a Hyperspace activity link.
The session ' s Report Group is misaligned, and the data source is incorrect; align the Report Group and switch to Chronicles.
The component ' s data source is misconfigured, and the session is outdated; align the data source and rebuild the session.
The Admissions data model is disabled, and the dashboard is not interactive; enable the data model and configure interactivity.
Answer:
AExplanation:
Blank output from a session whose filters are right is a data availability problem. The scenario is addressed by the following: the data is not extracted to Caboodle, and users lack Report Group or activity link security points; schedule ETL processes, update the Access form, and configure a Hyperspace activity link. SlicerDicer can only summarize what is in the warehouse, so the first thing to verify is that the required data has been extracted and loaded. Other settings, including security and report groups, influence visibility and do not explain an empty result for a user who can open the session. The developer should confirm the extract schedule, review the logs for errors and check that the relevant fact table contains rows for the selected period. When the data is found to be missing, the mapping or the schedule should be corrected and the load rerun. Testing the session again with a broad population, then narrowing it step by step, is an efficient way to locate any criterion that eliminates the remaining rows.
To create advanced SlicerDicer with user-defined custom measures using expressions, but not in standard.
Options:
Custom measures require FDM modifications or Clarity
Standard only
No
Yes
Answer:
AExplanation:
Custom measures that rely on user-defined expressions are not available in the standard SlicerDicer experience. A user can choose from the measures that the data model offers, determined by the available filters and their data types, but cannot write an expression of their own. If such a measure is needed, it requires changes to the model in FDM or the use of a different tool such as Clarity, where SQL can be written directly. The first option is correct. The statement that only standard measures exist ignores the possibility of extending the model, and the answers no and yes do not address the question. The design keeps the tool simple for self-service users and ensures that the measures are defined consistently, so that two people who ask the same question receive the same answer. A developer who receives such a request should first check whether an existing field could provide the value, and if not, evaluate the data available to add a calculated field to the model, balancing the effort against the number of users who would benefit.
A Reporting Workbench report omits data for a specific clinic. The report uses Chronicles. What is the issue?
Options:
The clinic ' s data is not in the Report Group.
The report ' s filters use an incorrect data model.
The data is not extracted to Caboodle.
The report is not enabled in the Analytics Catalog.
Answer:
AExplanation:
Missing data for a specific unit in a Workbench report that reads Chronicles is typically traced to the report group. The correct answer is: the clinic ' s data is not in the Report Group. Report groups set the boundaries of the data that users of the report can retrieve, and an area that is not included will be absent from every run. Neither Caboodle extraction nor the catalog ' s enablement affects a report that searches the operational database. The developer should check the group ' s definition, request the inclusion of the unit if it is justified and rerun the report. As a final check, the count of records for the unit should be compared with an independent source, such as a unit census, to confirm that the report is now complete. Where several settings could plausibly be responsible, changing one at a time and retesting after each change makes it possible to learn which setting actually solved the problem, which is useful knowledge for later maintenance.
True or False: In advanced Cogito, you can create a dashboard parameter that dynamically generates options from a Clarity query at runtime, allowing users to select from live data values for filtering.
Options:
True
False
Answer:
AExplanation:
The statement is true. A dashboard parameter can be configured so that its options are generated at runtime from a query, which allows users to select from live data values for filtering and not from a fixed list that someone has to maintain. When a new value appears in the data, it becomes available in the parameter automatically, which reduces the maintenance burden for developers and ensures that users always see current choices. The parameter then passes the selected value to the components that are linked to it, which respond by filtering their results. The approach is particularly useful for values that change often, such as departments, providers or clinics. Developers should ensure that the query that generates the options is efficient, since it runs when the dashboard is opened, and that it returns only the values that the user is entitled to see. They should also confirm that every component linked to the parameter is able to use its values, because a component that does not support the parameter will not update when the selection changes.
To diagnose why a Caboodle-based SlicerDicer session does not show data from a custom Clarity table, what tool to check extraction?
Options:
Clarity Dictionary for table definitions and Caboodle admin for dimension status
Record Viewer
Dashboard logs
Workbench test
Answer:
AExplanation:
When a Caboodle-based SlicerDicer session does not show data from a custom Clarity table, the extraction path must be examined. The Clarity Dictionary provides the definition of the table and its columns, which confirms that the table exists as expected and shows how it is keyed, and the Caboodle administration tools show the status of the dimension that is meant to receive the data, including any errors in the load. The first option is correct. The Record Viewer displays Chronicles values and does not explain the movement of data into Caboodle. Dashboard logs relate to the display of components. A Workbench test would search Chronicles, a different source from the one in question. A common cause is that a custom table has not been included in the extract or that its mapping to the warehouse was never created, so the load has nothing to carry. The developer should confirm that the table is populated in Clarity, then verify the mapping and schedule for the warehouse, and finally check that the data model refers to the correct dimension.
What is the owning application?
Options:
The application responsible for maintaining this dashboard.
User who created
Database
Component
Answer:
AExplanation:
The owning application is the application that is responsible for maintaining the dashboard. It is recorded on the Basic Information form and identifies which Epic application area, such as a clinical or revenue application, is accountable for the content and for its upkeep. The first option is correct. It is not the individual user who created the record, it is not a database and it is not a component. The setting has practical value in a large organization, where many dashboards exist and it is not always clear who should be contacted when one needs to be revised or stops working. It also helps with governance, because content can be grouped, reviewed and retired according to the area that owns it. When a developer builds a new dashboard, the owning application should be chosen to reflect the team that will support it over time and not simply the team that happened to build it. If responsibility moves to another team, the field should be updated so that the record continues to be accurate.
Tables in Clarity that begin with AUDIT_ITM:
Select all that apply (1 PT)
Options:
Can be used to audit all items in Chronicles
Can be used to audit any item in Chronicles for which auditing is turned on
Cannot be recovered because the data is purged from Chronicles
Have data that can be researched with the Record Viewer
Answer:
B, DExplanation:
The AUDIT_ITM tables in Clarity hold the audit trail that Chronicles records when item auditing is enabled. Auditing is a deliberate configuration: it is activated for specific items that warrant a history of changes, so these tables can answer questions about who changed a value and when, but only for items on which auditing has been turned on. That is the sense of the second option. The first option overstates the coverage, since turning auditing on for every item would be impractical and is not the design, and items without auditing leave no trail to extract. The third option is incorrect: the point of the audit tables is that the change history is retained and extracted to Clarity, making it recoverable for analysis. The fourth option is correct because the underlying audit data resides in Chronicles, where the Record Viewer can be used to examine it for a record, allowing an analyst to corroborate what the Clarity table shows or to research a specific change. Together these characteristics make the tables a targeted forensic resource rather than a universal log, and an analyst should first confirm that auditing was active for the item in question.
A SlicerDicer session in a dashboard component, using the Patients data model, returns no data despite correct filters and an enabled dashboard. The session is linked to Caboodle, and some users report access issues. What are the likely causes, and how should they be addressed?
Options:
The data is not extracted to Caboodle, and users lack Report Group access; schedule ETL processes and update the dashboard ' s Access form.
The session ' s Report Group is misaligned, and security points are incorrect; align the Report Group and update security classes.
The component ' s data source is misconfigured, and the session is outdated; align the data source and rebuild the session.
The Patients data model is disabled, and the dashboard is not enabled; enable the data model and dashboard.
Answer:
AExplanation:
An empty result from a correctly configured session suggests that the warehouse has nothing to show. The recommended resolution is: the data is not extracted to Caboodle, and users lack Report Group access; schedule ETL processes and update the dashboard ' s Access form. Because the tool queries Caboodle, anything that has not been extracted to it is invisible, no matter how the session is arranged. Changing the report group, the component ' s security or the model settings would alter who can use the content and not what the content contains. The analyst should check the date of the latest data in the relevant table, review failures in the ETL, and confirm that the data model points to the correct dimension and fact tables. It is also worth verifying that the data is actually generated at the source, for example that a new department or clinic is active in Chronicles. Once the load has been corrected, a quick comparison with a known figure confirms that the component is now accurate.
A metric-based component on a Radar dashboard shows inconsistent data for users in different regions. The component uses Dashboard Resources and is configured with summary targets. What could cause this issue?
Options:
Regional users lack the necessary security class for Reporting Workbench.
The component ' s Summary Target Lookup Method is set to " User-Specific. "
The SlicerDicer session is not synchronized with Caboodle.
The dashboard ' s Access form excludes regional Report Groups.
Answer:
BExplanation:
A metric-based component that uses dashboard resources and summary targets can show inconsistent data for users in different regions if the Summary Target Lookup Method is set to User-Specific. With that setting, the target for each user is determined from their own context, such as their region or department, so two people looking at the same component may see different targets and therefore different comparisons. The second option is correct. A missing Reporting Workbench security class would affect an entirely different tool. A SlicerDicer session that is out of step with Caboodle is not relevant to a component that is based on dashboard resources and summary targets. An Access form that excludes regional report groups would prevent users from seeing the dashboard at all and would not produce inconsistent values. The developer should review the lookup method and decide whether users should see targets tailored to them or a single common target. If the difference is intentional, the component should say so, for example in its title or description, to prevent users from believing that the figures are wrong.
What is a component?
Options:
A single graph or table or other piece of functionality that your users will interact with on the dashboard.
Full dashboard
Database table
Security class
Answer:
AExplanation:
A component is a single graph, table or other piece of functionality with which users interact on a dashboard. It is the basic building block of Radar content. A dashboard is assembled by placing components in the regions defined on its Layout form, and each component has its own data source, display settings and access configuration, which are maintained in the Component Editor. The first option is correct. A full dashboard is a collection of components and not a single one. A database table belongs to Clarity or Caboodle. A security class defines permissions in the system. Understanding this structure helps developers to plan their work, since a component can be reused on several dashboards and a change to it affects each dashboard on which it appears. This is an advantage for consistency but also a reason for caution when editing a shared component. Developers should confirm which dashboards use a component before changing it, and should test the result in each context to ensure that the change does not disrupt any audience that relies on it.
A Radar dashboard is visible but its components are not clickable for some users. What should be verified?
Options:
The users ' security points for component interaction.
The dashboard ' s data source configuration.
The SlicerDicer session ' s database connection.
The dashboard ' s Layout form settings.
Answer:
AExplanation:
A dashboard that is accessible but not interactive for certain users has a permissions gap and not a design flaw. The scenario is addressed by the following: the users ' security points for component interaction. Radar separates the right to see a dashboard from the right to interact with its components, so a user may open the page and still be unable to use its features. Settings on the Layout form or the data source would not discriminate between users. The analyst should check the security classes of those affected, find which points are missing and arrange for them to be granted. If the audience should not have interactive rights, the component ' s description should explain that it is read-only for them, so that expectations are clear and the number of support requests is reduced. The analyst should also tell the requester what was changed and when the correction takes effect, since users often assume that a repair is immediate when some changes appear only after the next load or a new sign-in.
In the Notification Editor, what does the General Tab do?
Options:
Selects which metric and summary level the notification tracks
Sets up the SQL query logic
Defines the report layout
Sends messages to the broadcast queue
Answer:
AExplanation:
In the Notification Editor, the General tab selects which metric and summary level the notification tracks. It establishes the basic subject of the alert, identifying the measure to be monitored and the level at which it is evaluated, such as department or provider, and later settings define the thresholds and recipients. The first option is correct. Setting up the SQL query logic is related to manual SQL-based metrics and not to this tab. Defining the report layout is a function of Reporting Workbench and of component configuration. Sending messages to the broadcast queue is not the role of the tab, although notifications ultimately deliver messages to the users. Understanding the structure of the editor allows a developer to configure a notification systematically: first choose the metric and level, then define the condition that triggers the event, and finally set the recipients and the message. If a notification is not behaving as expected, the General tab should be reviewed to confirm that it is tracking the intended metric at the intended level, since an error there affects every later setting.
Where can you define thresholds to highlight results in a Table Component?
Options:
Slicer tab in Preferences
Visualization dropdown
Component-level personalization options
Access tab of Dashboard Editor
Answer:
CExplanation:
Highlighting thresholds for results in a table component are set through the component-level personalization options. A user who wants to emphasize results above or below a value can define the threshold for the component on their own view, and the application stores that preference in the user ' s personalization. This is the third option. The Slicer tab in Preferences is not where component highlighting is configured. The Visualization dropdown selects how data is displayed, for example as a graph or table, and does not define thresholds. The Access tab of the Dashboard Editor decides who may use the dashboard and has no relationship to the display of values. The relevant distinction is between configuration for everyone and personalization for one user. A developer who wants every user to see the same highlighting would configure it on the source component, whereas an individual who wants a different threshold for their own purposes uses the personalization options. Because personalization is stored separately, it persists for the user and is not affected by other users ' choices, although it can be reset to return to the source settings.
A dashboard component must display a pie chart of patient demographics. Which configuration is required?
Options:
Use Dashboard Resources and configure a pie graph in the Component Editor.
Create a SlicerDicer session with demographic filters.
Set the data source to Clarity and enable summary targets.
Assign a new Report Group for chart access.
Answer:
AExplanation:
A requirement to show a specific chart is satisfied by setting up the display in the component and connecting it to the dashboard resources. The correct configuration is: use Dashboard Resources and configure a pie graph in the Component Editor. The data source and the output format are both settings of the component, and together they determine what is shown and how. The other options propose a session with filters, a different source with targets or a new report group, none of which produces the chart in the way described. The developer should check that the values are grouped at the appropriate level, for instance by week, month or demographic category, and should view the finished chart with a typical user to ensure that it is legible and that the colors are accessible. Reviewing the work against the guiding principles for analytics content, namely that the content works, that each part works, that the audience is defined and that the audience has the security it needs, is a reliable final check.
A metric component on an advanced dashboard uses a definition from IDN that aggregates data from Caboodle facts with custom logic. To make it advanced by adding thresholding for alerts (e.g., color change if > 95%), what in component?
Options:
Set output to conditional formatting based on threshold rules in Output Format
Use Native HTML for thresholds
Link to alert activity
User personalization
Answer:
AExplanation:
To add thresholding to a metric component, so that its color changes when a value exceeds a limit such as ninety-five percent, the developer sets the output to use conditional formatting based on threshold rules in the Output Format form of the Component Editor. The rules compare the displayed value with defined limits and apply the corresponding color or indicator, which gives users an immediate signal of status. The first option is correct. Native HTML could be used to build custom styling but would sacrifice the built-in behavior and require more maintenance. Linking to an alert activity would notify users but would not change the appearance of the component. User personalization lets individuals modify their own views and is not the mechanism for defining organizational limits. The thresholds should reflect agreed targets, and the colors should be chosen with accessibility in mind, so that the meaning is not conveyed by color alone. After configuring the rules, the developer should test values on both sides of each limit to be sure that the formatting changes at the correct point.
A Radar dashboard component, linked to a SlicerDicer session using the Admissions data model, displays outdated patient admission data from Caboodle and lacks drill-down to admission details. Some users report inconsistent threshold indicators. How should the analyst resolve these issues?
Options:
Increase ETL frequency to update Caboodle, configure a Hyperspace activity link for drill-down, and enable User-Specific Threshold Overrides in the Component Editor.
Switch the session to Chronicles for real-time data, rebuild the session, and update security points for thresholds.
Assign a new Report Group to align the session, rebuild in Clarity, and configure summary targets.
Rebuild the session in Hyperspace, disable drill-down, and update the component ' s data source.
Answer:
AExplanation:
A session that reads from Caboodle can show only what the most recent warehouse load has delivered. When users report stale, outdated or incomplete figures, the cause is therefore usually the load schedule, and the remedy is to update the warehouse more often. For this scenario the correct approach is: increase ETL frequency to update Caboodle, configure a Hyperspace activity link for drill-down, and enable User-Specific Threshold Overrides in the Component Editor. The extracts from Clarity and the subsequent Caboodle load run on a schedule, so a component built on a session is always as current as the last successful run. Changing the filters, assigning a different report group or rebuilding the session does not add records that have not been loaded, and switching to Chronicles is not an option for SlicerDicer, which does not query the operational database. The developer should review the load logs with the Caboodle administrator, check for failed or partial runs, and agree a frequency that suits the business need, remembering that more frequent loads consume system resources. Users should also be told the time of the last refresh, so that they interpret the figures with the correct expectation.
How are Private Reports different from Public Reports?
Options:
Private reports are only visible to the creator by default
Private reports are read-only
Private reports appear in all libraries
Public reports are only for Clarity
Answer:
AExplanation:
Private reports are only visible to the creator by default. A user who builds a report keeps it private until they decide to share it, and other users do not see it in their Library. Public reports, by contrast, are visible to users who have access to the template on which they were built. The first option is correct. The statement that private reports are read-only is not accurate, since the creator can edit them. Private reports do not appear in all libraries, because that would make them public. Public reports are not limited to Clarity, as Workbench reports search Chronicles. The distinction supports a sensible workflow: a user can develop and test a report privately, confirm that it returns the right results and then make it public so that colleagues can use it. Making a report public carries a responsibility for its accuracy, so the creator should verify the criteria and columns first. The ability to edit public reports is controlled by security classes, which prevents unauthorized changes to shared content.
A dashboard component displaying clinic throughput metrics requires row-specific threshold indicators that adjust dynamically based on clinic size. The component uses Dashboard Resources. Which configuration enables this functionality?
Options:
Enable Threshold Overrides and Dynamic Thresholds in the Component Editor ' s Output Format form.
Set the Summary Target Lookup Method to " Clinic-Specific " in the Data Source form.
Configure the data source as Reporting Workbench and add clinic size filters.
Add a slice for clinic size in the linked SlicerDicer session.
Answer:
AExplanation:
Threshold behavior is part of the component ' s output configuration. For the scenario described, the correct step is: enable Threshold Overrides and Dynamic Thresholds in the Component Editor ' s Output Format form. This places the logic where Radar expects it, in the Output Format form, and allows each row or context to be compared with an appropriate target. Selecting a different lookup method would change how targets are found, not how they are drawn, and edits to sessions or access settings are unrelated. After making the change, the developer should test the component with values below, at and above each limit and confirm that the indicators change correctly. The thresholds should be reviewed periodically with the business owners, because targets change over time and an outdated limit can mislead users into believing performance is acceptable or poor when it is not. Where several settings could plausibly be responsible, changing one at a time and retesting after each change makes it possible to learn which setting actually solved the problem, which is useful knowledge for later maintenance.
How do you open the Item Information window in Hyperspace?
Options:
CTRL + Left Click on the field
Right-click and press " Inspect "
ALT + Shift on any label
Double-click the tab header
Answer:
AExplanation:
The Item Information window in Hyperspace is opened by holding the Control key and left-clicking on the field. The window displays the Chronicles details for the field, such as the master file, the item number and a description, which allows an analyst to identify exactly where the value is stored. This is the first option. Right-clicking and choosing an Inspect command is not the method used in the application. The Alt and Shift combination on a label does not open the window. Double-clicking the tab header has no such function. The technique is commonly used when beginning to research a report requirement, because the user can see a value on the screen and needs to determine its source. After identifying the item, the analyst can look it up in the Data Dictionary to find the Clarity table and column, and can use the Item Editor to review its definition, including the add type and response type. Security may determine whether the window is available, so access should be checked if it does not open.
What does it mean to share a SlicerDicer session?
Options:
Export the dashboard as PDF
Send a read-only version of your data to another user
Use the Export Wizard to email all user settings
Save the component record and share via Link
Answer:
BExplanation:
Sharing a SlicerDicer session allows a user to send the analysis to a colleague so that the colleague can see the same population and results without having to rebuild them. The recipient receives a read-only version, which is the meaning of the second option. The recipient can examine the session but cannot change the original, which preserves the sender ' s analysis. Exporting a dashboard as a PDF is a different operation that produces a static document. The Export Wizard is used for transferring configuration between environments and does not email user settings. Saving a component record and sharing it through a link relates to Radar and does not describe SlicerDicer sharing. The recipient ' s access to the data is also governed by their own security, so the underlying records they see depend on their rights and not on those of the sender. This is an important consideration when sharing across departments. Where a user wants a colleague to continue the analysis, the colleague should create their own copy of the session, adjust it as needed and save it separately from the original.
What information can the Item Editor provide about a Chronicles item?
Select one of the following (1 PT)
Options:
List of locations where the item is used in Hyperspace
Clarity tables that extract the item
How frequently the item is populated
Add type and response type
Answer:
DExplanation:
The Item Editor is the Chronicles tool for reviewing an item definition. It is concerned with the properties and behavior of the item across every record in its master file, not with values stored for a particular patient or encounter. Those properties include the item name and number, data type, add type, response type, category list association and, for networked items, the master file to which the item points. Add type and response type are therefore the correct pairing. These two properties are the most useful for data architecture work because they determine how the item is stored and, in turn, how it is shaped in Clarity. The remaining options describe information held elsewhere. Clarity table and column mappings are researched in the Data Dictionary, which presents Chronicles Info for each column. Usage in Hyperspace is not a property the Item Editor reports. How often an item is populated is a question about data, answered by querying Clarity or inspecting records, since an item definition says nothing about volume. Record-level values belong to the Record Viewer. Distinguishing definition from data is the core principle tested here.
An analyst needs to restrict a Radar dashboard to quality assurance staff. Where should this be configured?
Options:
The dashboard ' s Access form in the Report Group settings.
The component ' s security points in Hyperspace.
The SlicerDicer session ' s user permissions.
The Analytics Catalog ' s visibility settings.
Answer:
AExplanation:
To make a dashboard visible only to a defined set of roles, the restriction is applied where the dashboard ' s audience is defined. The correct choice is: the dashboard ' s Access form in the Report Group settings. The Access form, together with report groups, controls who can open the dashboard, and changes there leave other dashboards alone. A component ' s security points, a session ' s user permissions and visibility settings in the catalog do not define the dashboard ' s audience in the same way. After the change, the developer should verify that members of the groups can open the dashboard and that others cannot, and should confirm that each component works for the permitted audience. It is also prudent to inform the business owner of the list of groups, so that they can validate that the restriction matches the policy. Reviewing the work against the guiding principles for analytics content, namely that the content works, that each part works, that the audience is defined and that the audience has the security it needs, is a reliable final check.
True or False: When creating a custom Clarity report for real-time analytics, you can use temporary tables within the SQL to optimize joins across large datasets, but this requires special database privileges and may affect extraction performance if not indexed properly.
Options:
True
False
Answer:
AExplanation:
The statement is true. In a custom Clarity report written in SQL, temporary tables can be used to stage intermediate results and optimize joins across large datasets, because breaking a complex query into steps allows the database to process each step efficiently. Creating them, however, requires special database privileges, which are not given to ordinary report users and must be arranged with the Clarity administrator. If the temporary tables are not indexed properly, they can slow the query, and heavy use of them during working hours can affect the performance of the database, including the extraction processes that share its resources. Developers should therefore use temporary tables judiciously, test the performance of the report with realistic volumes and schedule heavy reports outside the windows in which the nightly extract runs. Clarity is intended for reporting on historical data, so a report that needs to be truly real time should not rely on it, since the data is only as current as the last extract. Good practice includes documenting the logic so that colleagues can maintain it.
What is the responsibility of the Cogito Business Analyst?
Options:
Manage the Clarity schema
Configure Crystal Report servers
Work with stakeholders to define reporting needs
Write Caboodle ETL scripts
Answer:
CExplanation:
The responsibility of the Cogito business analyst is to work with stakeholders to define reporting needs. This role acts as the bridge between the people who need information and the people who build it. The analyst asks what data is needed, why it is needed and how it will be used, translates the answers into specifications, and helps to decide which tool is appropriate, whether that is a Workbench report, a SlicerDicer model, a dashboard or a SQL report. The third option is correct. Managing the Clarity schema is the responsibility of the Clarity administrator. Configuring Crystal report servers is the work of the BOE administrator. Writing Caboodle ETL scripts is carried out by Caboodle developers. A well defined requirement saves time later in the process, because developers can build the correct content the first time, and the business analyst is therefore central to avoiding rework. The role also validates the finished content with stakeholders, checking that the numbers match expectations and that the output answers the original question, before it is released to users.
You want to view a population of hypertensive patients grouped by gender. What should you use?
Options:
A filter
A visualization setting
A measure
A slice
Answer:
DExplanation:
Grouping a population of hypertensive patients by gender requires a slice. The population is already defined, and the requirement is to divide it into subgroups so that the results can be compared by gender. Adding a slice for gender produces one group for each value and calculates the measure for each. A filter would restrict the population to a single gender, which would remove the comparison rather than create it. A visualization setting changes only how the results are drawn and does not introduce grouping. A measure determines what is calculated, such as a count or a percentage, and it does not divide the population. The distinction among these controls is central to the tool. Criteria and filters decide who is included, slices decide how those people are grouped, measures decide what is calculated and the visualization decides how it appears. When a user reports that a chart shows a single total bar although a breakdown was expected, the absence of a slice is the usual cause, and adding the appropriate field corrects the display without changing the population.
What ' s the benefit of using a Report Model over building from a template directly?
Options:
It includes predefined logic and guidance from Epic to fill in local values
It automatically fills in patient data
It creates security access
It prevents report expiration
Answer:
AExplanation:
The benefit of using a report model over building from a template directly is that it includes predefined logic and guidance from Epic, with spaces in which the organization fills in local values. Epic builds the structure and logic of the report to address a common need, and the organization supplies the details that are specific to its environment, such as the particular codes or departments used. This shortens development time and promotes consistency. The first option is correct. A report model does not automatically fill in patient data, since data is retrieved when the report is run. It does not create security access, which is handled through report groups and security classes. It also does not prevent report expiration, which is controlled by the Valid Until setting. Using a model is similar in spirit to using Epic-released content from the Report Repository, because both start from Epic ' s design and reduce the amount of work to be done locally. Developers should review the guidance that accompanies the model so that the local values are entered accurately.
What tool can be downloaded from Galaxy and can identify tables used for reports for an application?
Select one of the following (1 PT)
Options:
Item Editor
Report Repository
Data Dictionary
ER Diagrams
Answer:
BExplanation:
The wording of the stem contains two clues: the tool is obtained from Galaxy, and it is organized around reports for an application. The Report Repository fits both. It is Epic ' s published library of delivered reports, and its entries are organized by application, so an analyst can review the delivered reports for an area and see the Clarity tables that those reports rely on. That is particularly useful when building a new report, because the tables used in comparable Epic content indicate where the required data is stored. The Item Editor is a Chronicles tool available within the Epic environment and is not downloaded from Galaxy. The Data Dictionary is the primary Clarity reference, but it is oriented to tables and columns rather than to reports, and it is accessed as an online reference rather than a downloadable report catalog. ER Diagrams display relationships among tables for a subject area and show how tables join; they do not list which tables each report uses. The distinction is between structure references, which describe the tables, and content references, which describe what has been built on them. The Report Repository belongs to the second group, and that is why it is the best answer here.
A custom component using Native SQL in Clarity fails to load on a dashboard for users with standard Radar security, but works for admins. The SQL queries a custom view joining multiple tables from different schemas, and error logs indicate permission denied on one schema. What advanced configuration in the component ' s Access form could resolve this?
Options:
Assign specific report groups to the component that grant Clarity schema permissions
Enable " Ready for use " and link to user types with extended security classes
Set the data source to Caboodle to bypass Clarity permissions
Modify the SQL to use dynamic parameters for schema access
Answer:
AExplanation:
A component that works for administrators but fails for users with standard Radar security, with a permission denied error on one schema, is a problem of access configuration. The relevant setting in the Access form of the component is the assignment of specific report groups that grant the necessary permissions, since report groups connect users to the content and the resources it relies on. Assigning the appropriate groups so that standard users share them with the component addresses the denial. The first option is correct. Enabling Ready for Use and linking user types with extended security classes concerns the availability of the component and broad security, and it would not resolve a specific schema permission. Changing the data source to Caboodle to bypass Clarity permissions would circumvent the security design and would change the data the component displays. Modifying the SQL to use dynamic parameters for schema access would not grant permissions that the user lacks. Administrators should work with the Clarity administrator to confirm which permission is required and ensure that the report groups map correctly, then retest with a standard user.
A Reporting Workbench report, sourced from Chronicles, fails to run for some users due to a custom filter for high-cost patients. The report includes a trace log. What could be the issue?
Options:
Users lack access to the custom filter ' s security class; update their security settings.
The report ' s data source is set to Clarity; switch to Chronicles.
The high-cost filter is not enabled in SlicerDicer; rebuild the filter.
The report ' s Report Group is misconfigured; update the Access form.
Answer:
AExplanation:
Reports that depend on protected filters can be executed only by users who hold the corresponding security. The correct answer is: users lack access to the custom filter ' s security class; update their security settings. The problem lies in the users ' access and not in the report ' s source or status. The developer should identify the required class, confirm with the data owner that the affected users are entitled to it and arrange for it to be granted. If the report also provides an export, the permission for that action should be checked, because it is separate from permission to run the report. Once the changes are made, running the report as an affected user verifies the repair, and recording the filter ' s requirements in the report documentation will help future administrators. Reviewing the work against the guiding principles for analytics content, namely that the content works, that each part works, that the audience is defined and that the audience has the security it needs, is a reliable final check.
What is a badge in the context of Radar components?
Options:
A small graphic showing a single data point
A user permission level in Reporting Workbench
A dashboard notification alert
A macro for SlicerDicer filtering
Answer:
AExplanation:
A badge in Radar is a small graphic that shows a single data point. It is used in table and graph components to draw attention to a value, for example by displaying a colored indicator when a result exceeds a threshold, so that users can see at a glance which rows need attention. The first option is correct. A user permission level in Reporting Workbench is a security concept and not a badge. A dashboard notification alert describes a different kind of feature, although alerts and badges can serve related purposes. A macro for SlicerDicer filtering is not a recognized meaning of the term. Badges are configured in the Component Editor, where the developer defines the data point and the conditions under which the badge appears. They improve usability because they reduce the effort of scanning large tables for exceptions. Developers should choose thresholds and visual styles that are meaningful and not excessive, since too many highlighted values make it harder for users to identify what is most important.
How can a user determine which templates or reports use a specific PAF record?
Options:
View the " Used in Reports " tab on the PAF record
Use the Report Repository
They cannot directly determine this
Look in the Analytics Catalog
Answer:
CExplanation:
A user cannot directly determine which templates or reports use a specific PAF record. PAF records, which define display columns, are shared building blocks that may be referenced in many templates and reports, but the application does not provide a where-used list on the record itself. There is no Used in Reports tab on the PAF record, so the first option is incorrect. The Report Repository lists content that Epic has released and does not index the local usage of display columns. The Analytics Catalog helps users discover content by name, tag and description, but it does not show which columns each report uses. The third option correctly states that this cannot be determined directly. The practical consequence is that an analyst should be cautious when changing or retiring a column, because the effect on existing reports is not visible in advance. A safer approach is to create a new column for a new purpose, leaving the existing one unchanged, and to test any modification in a copy of an affected report before relying on it.
Which of the following can users do from the Results Viewer after running a Workbench report? Select all that apply.
Options:
Adjust the criteria of the report to change which results are returned
Use action buttons to take action on the results
Filter results based on the values in the display columns
Use the Explore tab to create visualizations
Answer:
B, C, DExplanation:
After a Workbench report is run, the Results Viewer is where the user works with the output. Several capabilities are provided. Action buttons allow the user to act on selected results, for example to open a record or launch a related activity directly from a row, so the second option is correct. Results can be filtered on the values in the displayed columns, which narrows what is visible without rerunning the search, making the third option correct. The Explore tab provides visualizations, allowing the user to chart the data returned by the report, which makes the fourth option correct. The first option does not apply. The criteria determine which records the search returns, and they are changed in the report settings before the report is run, not from the Results Viewer. If different records are needed, the user must edit the settings and run the report again. The distinction is useful for support: a user who cannot see a record needs the criteria reviewed, whereas a user who wants to find a value within the results should use column filters. The viewer therefore refines and acts upon the existing result set.
A dashboard component must display real-time patient transfer data with a link to the Transfer Coordination activity and dynamic thresholds based on transfer type and urgency. Which data source and configuration ensure this complex functionality?
Options:
Chronicles; configure real-time extraction, a Hyperspace activity link, and Type-Urgency Dynamic Thresholds in the Component Editor.
Caboodle; schedule frequent ETL processes, enable summary targets, and add type-based filters.
Clarity; set aggregated data, link to a SlicerDicer session, and configure threshold overrides.
SlicerDicer; add a real-time transfer filter, configure Action Groups, and enable dynamic thresholds.
Answer:
AExplanation:
A component that must show what is happening now has to rely on the live database. The solution is: chronicles; configure real-time extraction, a Hyperspace activity link, and Type-Urgency Dynamic Thresholds in the Component Editor. Using Chronicles with real-time extraction provides current values, and the link to the Hyperspace activity completes the workflow by allowing the user to open the relevant screen. The remaining choices refer to ETL-based sources or session filters, which cannot deliver real-time data. The developer should keep the scope of the data narrow, to protect system performance, and should verify the behavior of the thresholds with realistic examples. Because the display informs immediate decisions, it should be tested thoroughly, and the owner should agree what refresh frequency is appropriate for the clinical or operational purpose. Where several settings could plausibly be responsible, changing one at a time and retesting after each change makes it possible to learn which setting actually solved the problem, which is useful knowledge for later maintenance.
A Reporting Workbench report does not show data for a specific clinic. The report uses Chronicles. What could be the cause?
Options:
The clinic ' s data is not included in the Report Group.
The report ' s filters use an incorrect data model.
The data is not extracted to Caboodle.
The report is not enabled in the Analytics Catalog.
Answer:
AExplanation:
When a report omits data for a single area although it works for others, the question is why that area is excluded from the user ' s view. The scenario is resolved by this: the clinic ' s data is not included in the Report Group. The report group lists the entities whose data the report may include, and any area that is absent from it will not appear in the output. Because the report searches Chronicles, there is no extract that might have failed. The developer should compare the group with the units of the organization, add the missing area where appropriate and test the report with a user who is meant to see it. If the omission is intentional, for privacy or scope reasons, the stakeholder should be informed that the data is outside the report ' s audience so that they do not interpret the gap as an error. Before release, the developer should retest the change with an account that has the same security as the intended audience, because a result that looks correct for a developer can still fail for a typical user.
When building custom reports, which parts of your record will be visible in the Analytics Catalog?
Options:
Display name, tags, and description
Only ID
Full code
Nothing
Answer:
AExplanation:
When a developer builds a custom report, the parts of the record that are visible in the Analytics Catalog are the display name, the tags and the description. These are the pieces of information that users read and search when looking for content, so they should be written clearly and with the audience in mind. The first option is correct. The ID alone would be meaningless to most users and is not what the catalog presents. The full code of a report is not displayed, because the catalog is a discovery tool and does not expose the underlying definition. The statement that nothing is visible is inaccurate, since the catalog exists to make content discoverable. The practical lesson is that the effort spent on naming and describing content has a direct effect on whether it is found and used. A report with an obscure name and no tags will be overlooked, even if it is well built. The Metadata Editor lets administrators correct the tags and descriptions of existing content, so that discoverability can be improved after the fact.
Which of the following forms are part of a component ' s configuration in the Component Editor?
Options:
Basic Information, Layout, Filters, Print Settings, Access
Display, Data Source, Table Design, Report Queue, Export
Basic Information, Display, Data Source, Output Format, Access
Source Record, Viewer Settings, Link Settings, Metadata, Permissions
Answer:
CExplanation:
A component record is configured through a set of forms, and the third option lists them correctly: Basic Information, Display, Data Source, Output Format and Access. Basic Information identifies the component and its type. Display sets the title and the presentation characteristics. Data Source defines where the component obtains its data, for example a report, metric or SlicerDicer session. Output Format controls how the results are produced for the user. Access governs who can use the component. The other options mix in items that either belong to the Dashboard Editor or do not exist. Layout is a dashboard form, since it arranges components on the screen, and not a feature of an individual component. Filters, Print Settings, Table Design, Report Queue, Export, Source Record, Viewer Settings, Link Settings, Metadata and Permissions are not the forms of the Component Editor. A useful comparison for retention is that the dashboard defines arrangement and the component defines content. When troubleshooting a component that displays the wrong data, the analyst should start with the Data Source form, whereas a component that displays correctly but is not visible to a user points to the Access form.
A dashboard component ' s Hyperspace activity link works for administrators but not for standard users. What is the likely cause?
Options:
Standard users lack security points for the activity.
The component ' s data source is set to Clarity.
The dashboard ' s Layout form restricts user interaction.
The activity descriptor is not enabled in Chronicles.
Answer:
AExplanation:
A link to a Hyperspace activity works only for people who are permitted to open that activity. When administrators succeed and other users fail despite a valid descriptor, the difference is security. The correct explanation is: standard users lack security points for the activity. The descriptor tells Radar which activity to launch, but it does not grant the right to use it, so each user ' s security class must include the necessary points. The other options look at the data source, the layout or the registration of the descriptor, none of which would produce a failure that affects only some users. The developer should compare the security class of a user who can open the link with that of one who cannot, identify the missing points and ask the security administrator to add them if the audience is meant to have the access. If the activity should not be available to everyone, the dashboard ' s audience should be narrowed instead. This follows the principle that every user of a dashboard must be able to use every component on it.
In the Chronicles hierarchy, what does a " Contact " represent?
Options:
A sheet of paper with information from one specific time (e.g., a visit)
The table header row in Clarity
The diagnosis summary
A user ' s contact list in MyChart
Answer:
AExplanation:
A contact in the Chronicles hierarchy is like a sheet of paper that holds information from one specific time, such as a visit. Within the folder that represents a record, each sheet captures what was true or what happened at a given point, so the folder gradually accumulates a history. The first option is correct. The table header row in Clarity is a relational concept and has no counterpart in the Chronicles hierarchy. The diagnosis summary is a collection of information and does not describe the structural concept of a contact. A user ' s contact list in MyChart is a patient portal feature. The notion of a contact explains how Epic preserves history while keeping a single record per entity. Information that changes is stored on a new contact, and earlier contacts are retained. When data is extracted to Clarity, contact-level data is represented by tables that include a contact serial number in their primary key, so analysts can recognize contact-level data when they find a CSN in the key.
When should you select " Enabled for user selection " ?
Options:
Select this when you want the dashboard to be available in the Analytics Catalog.
Never
Always
Only for admins
Answer:
AExplanation:
Enabled for user selection should be selected when the dashboard is to be available in the Analytics Catalog. This setting allows users to find the dashboard and choose it themselves from the catalog, as distinct from receiving it through some other route. The first option is correct. It should not be left unselected as a rule, since the dashboard would then be hard for users to find, and it should not be selected indiscriminately, because some dashboards are intended to be reached only through other content or by particular roles. Selecting it for every dashboard would clutter the catalog with items that most users do not need. The developer should decide who the audience is and whether browsing is the right way for them to reach the dashboard. The setting works together with Ready for Use, and both must be appropriate for the dashboard to appear. The display title and description should also be reviewed beforehand, because users will see them in the catalog and rely on them to decide whether to open the dashboard.
A Reporting Workbench report, sourced from Chronicles, fails to execute for some users due to a custom filter for high-acuity patients, despite a trace log and Ready for Use status. The report groups data by care unit and calculates length of stay variance, but some users report no benchmarking export. What are the issues, and how should they be resolved?
Options:
Users lack access to the custom filter ' s security class and benchmarking export permissions; update their security settings and enable export in Report Settings.
The report ' s data source is set to Clarity, and export is disabled; switch to Chronicles and enable export.
The high-acuity filter is not enabled in SlicerDicer, and the session is outdated; rebuild the filter and session.
The report ' s Report Group is misaligned, and the dashboard is not enabled; update the Access form and enable the dashboard.
Answer:
AExplanation:
Reports that depend on protected filters can be executed only by users who hold the corresponding security. The correct answer is: users lack access to the custom filter ' s security class and benchmarking export permissions; update their security settings and enable export in Report Settings. The problem lies in the users ' access and not in the report ' s source or status. The developer should identify the required class, confirm with the data owner that the affected users are entitled to it and arrange for it to be granted. If the report also provides an export, the permission for that action should be checked, because it is separate from permission to run the report. Once the changes are made, running the report as an affected user verifies the repair, and recording the filter ' s requirements in the report documentation will help future administrators. After the correction, a comparison with an independent source, such as an operational list or a known total, confirms that the output is complete and that no secondary problem remains hidden behind the first.
To optimize a SlicerDicer for very large populations with advanced slices on temporal data, what?
Options:
Use pre-aggregated Caboodle facts and limit slices to indexed fields
No optimization
Use Clarity
Small populations only
Answer:
AExplanation:
To keep a SlicerDicer session responsive when it covers a very large population and includes advanced slices on temporal data, the developer should rely on pre-aggregated Caboodle fact tables and limit the slices to indexed fields. Pre-aggregated facts reduce the number of rows that must be processed, and indexes allow the database to locate and group the values efficiently. The first option is correct. Doing nothing would leave users with slow sessions. Using Clarity would move the work to a platform designed for different purposes and would not take advantage of the warehouse ' s dimensional structure. Restricting the analysis to small populations defeats the purpose of a population health tool. A date slice can be heavy when it is applied at a fine level of detail, so offering a coarser unit, such as month instead of day, improves speed and often readability. The developer should measure the time taken before and after the change, using realistic volumes, and keep the data model free of fields that are rarely used, so that the list of slices remains manageable.
A supervisor asks for a real-time list of patients needing discharge instructions today. Which report type should be used?
Options:
Analytical
Operational
SQL batch job
SlicerDicer snapshot
Answer:
BExplanation:
A real-time list of patients needing discharge instructions today should be provided by an operational report. The supervisor needs current information in order to act during the day, and the list will change as patients are discharged and new ones are added, so the data must come from the operational database and be available within Hyperspace. The second option is correct. An analytical report would be based on historical data and trends and would not serve an immediate task. A SQL batch job would rely on scheduled extraction and would not be real time. A SlicerDicer snapshot reflects the most recent load of the warehouse and does not provide current data. Reporting Workbench is the usual tool for this kind of report, because it searches Chronicles directly and returns results quickly. The analyst should ensure that the criteria are efficient, using indexed items where possible, and that the list is limited to what the supervisor needs, so that it can be used in the workflow. A short valid-until period keeps the results fresh.
A Cogito SQL report, sourced from Clarity, groups inpatient stays by care unit and calculates multiple metrics (e.g., average length of stay, cost), with a trace log. The report must be restricted to unit managers, support Epic benchmarking export, and allow dynamic filtering by patient age group. Which configuration is correct?
Options:
Use Clarity, group via the Display tab, enable trace logging, assign a Report Group for unit managers, configure benchmarking export, and add an age-group filter in Report Settings.
Build in Chronicles, configure summary targets, disable ad hoc searches, set security points, and enable benchmarking in SlicerDicer.
Create in SlicerDicer, add care unit slices, enable trace logging, restrict via Action Groups, and add age-group filters.
Use Caboodle, assign user roles in Hyperspace, configure Threshold Overrides, and enable benchmarking in Clarity.
Answer:
AExplanation:
When requirements include grouped summaries, multiple metrics, a trace log and a restricted audience for a report on Clarity data, the combination described in the correct option is the one that satisfies all of them: use Clarity, group via the Display tab, enable trace logging, assign a Report Group for unit managers, configure benchmarking export, and add an age-group filter in Report Settings. Each element has a purpose. The data source provides the information, the Display tab arranges the summary, the log documents activity and the report group controls access. The incorrect options either use Chronicles for SQL reporting, rely on a SlicerDicer session that cannot supply custom logic, or place unrelated settings together. The developer should test the report ' s performance, confirm that the log records runs and make sure that only the designated users can open it. Reviewing the finished report with the requester ensures that the grouping and metrics answer the actual question.
An analyst configures a Reporting Workbench report to display patient demographics with a custom filter for age groups. The report fails to run for some users. What could be the cause?
Options:
Users lack access to the custom filter ' s security class.
The report ' s data source is set to Clarity instead of Chronicles.
The age group filter is not enabled in SlicerDicer.
The report is not marked Ready for Use in the Analytics Catalog.
Answer:
AExplanation:
A Workbench report that displays patient demographics with a custom filter for age groups, and runs for some users but not others, most probably relies on a filter that is protected by a security class which the failing users do not have. A custom filter is part of the report ' s design, and if its use requires a particular class, anyone without it cannot run the report. The first option is correct. The data source of a Workbench report is Chronicles, so the second option does not describe the usual configuration. The age group filter does not need to be enabled in SlicerDicer. The Analytics Catalog does not control whether a report can be run, so the final option is not relevant. The developer should compare the security of a user for whom the report works with that of one for whom it fails, identify the missing class and ask the security administrator to grant it where appropriate. If the filter should be available to everybody, the requirement for the class can be reviewed with the content owner, taking care to protect the data that the class was intended to guard.
An analyst needs to restrict a Radar dashboard to specific user roles without affecting other dashboards. Where should this restriction be applied?
Options:
The dashboard ' s Access form in the Report Group settings.
The component ' s security points in Hyperspace.
The SlicerDicer session ' s user permissions.
The Analytics Catalog ' s visibility settings.
Answer:
AExplanation:
Limiting a dashboard to particular roles, without changing other content, is done on the dashboard ' s Access form through the report groups that are assigned to it. The correct location is: the dashboard ' s Access form in the Report Group settings. The form determines which groups and user types may open the dashboard, so the restriction applies to that dashboard alone. Security points in Hyperspace are broader, session permissions govern the session and not the dashboard, and the catalog ' s visibility settings influence discovery and not the right to open. The developer should add only the groups of the intended audience, then test with a member of the group and with a user outside it, confirming that the second cannot see the dashboard. The components on the dashboard must also be accessible to the audience, because Radar requires that every user be able to use every component. Before release, the developer should retest the change with an account that has the same security as the intended audience, because a result that looks correct for a developer can still fail for a typical user.
PAT_ENC is an overtime single table extracting data from the EPT master file. It contains 1 row for every encounter. The primary key is PAT_ENC_CSN_ID. PAT_ENC_DX is an overtime multiple table that also extracts data from the EPT master file. It contains 1 line for every diagnosis associated with an encounter. The primary key is PAT_ENC_CSN_ID and LINE.
Part 2 of 2
If you were to join on the condition PAT_ENC_DX.PAT_ENC_CSN_ID = PAT_ENC.PAT_ENC_CSN_ID, what would be the granularity of the result set?
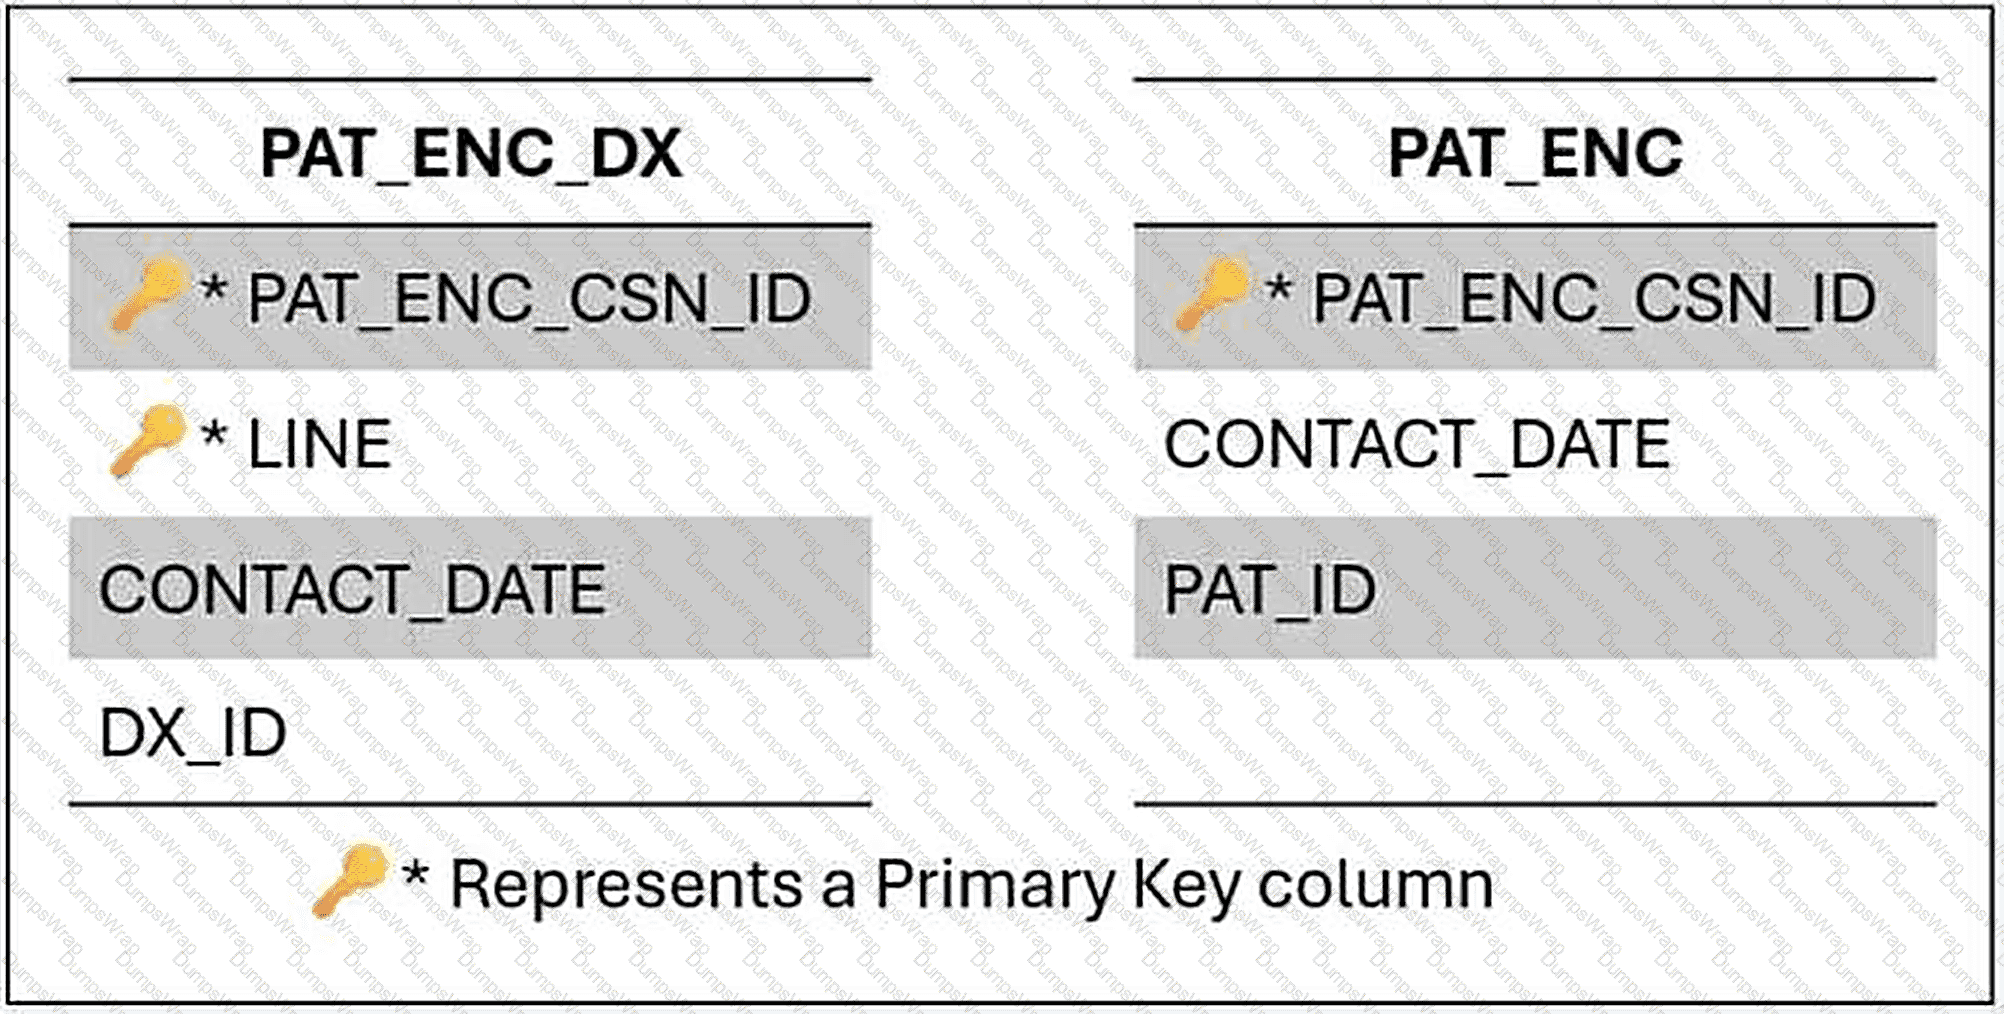
Select one of the following (1 PT)
Options:
1 row per diagnosis attached to an encounter
More than 1 row per diagnosis attached to an encounter
0 rows will be returned because PAT_ID is not part of either primary key
1 row per patient encounter
Answer:
AExplanation:
Granularity after a join is determined by the table on the many side of the relationship. Each row in PAT_ENC_DX corresponds to a single diagnosis on a single encounter, and each of those rows matches exactly one row in PAT_ENC, because PAT_ENC_CSN_ID is the complete primary key of PAT_ENC. The join therefore attaches encounter attributes, such as the contact date and patient identifier, to each diagnosis row without duplicating any of them. The row count equals that of PAT_ENC_DX and the grain remains one row per diagnosis attached to an encounter. More than one row per diagnosis would occur only if the join key failed to be unique on the opposite side, which would be the case if PAT_ENC contained several rows per CSN; its key prevents that. The claim that no rows are returned is mistaken, since the join condition does not involve PAT_ID and nothing requires that column to belong to a key. One row per encounter would be the result only if the diagnoses were aggregated, for instance by grouping on the CSN, which the query does not do. Anticipating granularity in this manner prevents inflated counts when measures from PAT_ENC are summed after the join.
I EPT 16163 has an add type of no add and a response type of multiple. I EPT 19165 has an add type of response each time and a response type of multiple.
Part 2 of 2
You would anticipate data from both items to be extracted to the same Clarity table.
Select one of the following (1 PT)
Options:
True
False
Answer:
BExplanation:
A Clarity table has one primary key, and every item extracted to it must be compatible with that key. Items 16163 and 19165 produce different keys. Item 16163 is no-add with a multiple response, so it is stored once per record with repeating lines and would be keyed by the record identifier and LINE. Item 19165 is response each time with a multiple response, so it is stored per contact with repeating lines and would be keyed by the contact serial number and LINE. Placing both in a single table would require one key to represent two different grains: one row per record line and one row per contact line. A table cannot do both without breaking the uniqueness of its rows or filling the key with unrelated values. Clarity therefore groups items by their add type and response type, and these two items land in separate tables, even though they share the same master file and the same multiple response type. The statement that they would be extracted together is false. This conclusion is consistent with the behavior of the Data Dictionary, where tables document their key structure and every column conforms to it.
A dashboard component must show a bar chart of patient visits by month. Which configuration is needed?
Options:
Use Dashboard Resources and configure a bar graph in the Component Editor.
Create a SlicerDicer session with a monthly filter.
Set the data source to Clarity and enable summary targets.
Assign a new Report Group for chart access.
Answer:
AExplanation:
Choosing the right visualization is a configuration step within the component. For this scenario the answer is: use Dashboard Resources and configure a bar graph in the Component Editor. The Component Editor lets the developer set the display format to a graph of the required type, and the dashboard resources provide the data. Creating a separate session or assigning a report group does not draw the chart, and a Clarity data source with summary targets is not the described route. The type of chart should be driven by the message: time-based data is clearest as a line, comparisons between groups as bars and proportions of a small number of categories as a pie. The developer should also give the chart a clear title and axis labels so that users can interpret it without asking for help. It is good practice to record the cause and the correction in the component or report description, so that colleagues who meet the same symptom later can resolve it quickly without repeating the investigation.
A dashboard component with a Hyperspace activity link fails to open the Patient Chart Review activity for non-admin users, despite a valid activity descriptor and Dashboard Resources as the data source. Admins can access the link, but non-admins report no data visibility. What are the causes, and how should they be fixed?
Options:
Non-admin users lack security points for the activity and Report Group access; update their security class and the dashboard ' s Access form.
The component ' s data source is misaligned with the SlicerDicer session, and the session is outdated; align the data source and rebuild the session.
The dashboard ' s Layout form restricts non-admin interactivity, and the data is not in Caboodle; enable interactivity and schedule ETL processes.
The activity descriptor is not registered in Chronicles, and the session uses Clarity; register the descriptor and switch to Caboodle.
Answer:
AExplanation:
When a Hyperspace link behaves differently for different users, the difference almost always comes from security. The solution to this scenario is: non-admin users lack security points for the activity and Report Group access; update their security class and the dashboard ' s Access form. The component ' s own configuration is valid, as shown by the fact that it works for some people. What differs is the user, and the activity opened by the link is protected by points that must be present in the user ' s class. Options that propose a different data source, a layout restriction or an unregistered descriptor would affect everyone equally. The recommended steps are to compare a working user with a failing one, to identify the missing points and to arrange the change through the security administrator. The organization should also confirm that granting the points is appropriate, because the activity may expose sensitive information that the user does not need for their role.
A Radar dashboard is accessible but its components are not interactive for some users. What should be checked?
Options:
The users ' security points for component interaction.
The dashboard ' s data source configuration.
The SlicerDicer session ' s database connection.
The dashboard ' s Layout form settings.
Answer:
AExplanation:
Interaction problems that affect only some users are diagnosed by comparing their security with that of users who are unaffected. The answer here is: the users ' security points for component interaction. Because the same dashboard works for others, the configuration of the dashboard, its data source and its layout are not the cause. What differs is the set of security points granted to each user. The developer should work with the security administrator to identify the difference and to determine whether the missing points are appropriate for the role. After they are added, users should sign in again, and the interaction should be tested. Recording the points that each dashboard requires helps when new roles are created, so that they receive the necessary access from the start. Reviewing the work against the guiding principles for analytics content, namely that the content works, that each part works, that the audience is defined and that the audience has the security it needs, is a reliable final check.
What does the " Base " determine in your SlicerDicer analysis?
Options:
The format of the exported results
The list of visualizations available
The starting population before any criteria are applied
The file path for saving results
Answer:
CExplanation:
The base determines the starting population before any criteria are applied. When a user opens SlicerDicer and selects a data model, one of the first choices is the group from which the analysis will begin, for example all patients, or only those in the user ' s own panel. Every criterion, filter and slice then works with that group. The third option states this. The format of exported results is determined by the export function and not by the base. The list of available visualizations depends on the data model and the selected measure and slice, and it is not defined by the base. The file path for saving results is not relevant, because sessions are saved within the application and not to a file path chosen by the user. The base also has a security dimension, because the options offered can depend on the user ' s access, and a user who can see only their own patients will have a narrower starting point. When a result seems too small, reviewing the base before adjusting criteria is an efficient way to identify whether the population was restricted from the beginning.
Why can ' t you view the data displayed by components in another user ' s dashboard while in Proxy Mode?
Options:
Epic disables components in Proxy
The user ' s data is deleted on logout
Due to security and data access restrictions
Proxy mode disables SQL rendering
Answer:
CExplanation:
While in Proxy Mode, the data displayed by components in another user ' s dashboard cannot be viewed because of security and data access restrictions. The mode is designed to let the analyst see the structure of what the user sees, such as which dashboards and components are available and how they are laid out, without exposing the user ' s data. Displaying the data would allow the person in proxy to see information that they might not be authorized to see, so the application withholds it. The third option states this reason. Epic does not disable components in Proxy Mode as a general matter; the layout is visible. The statement that the user ' s data is deleted on logout is inaccurate, since proxy viewing has no effect on stored data. Proxy mode does not disable SQL rendering. The limitation is a deliberate protection and is consistent with the other restrictions of the mode, such as the inability to run reports. To verify that data appears correctly for a user, the analyst should ask the user to confirm what they see, or compare their security with that of a user who can display the data.
A Radar dashboard component, linked to a SlicerDicer session, displays outdated ED wait time data from Caboodle. The session uses the Encounters data model. How should this be resolved?
Options:
Increase ETL frequency to update Caboodle and verify the session ' s data source.
Switch the session to Chronicles for real-time wait time data.
Rebuild the session with updated filters in Hyperspace.
Update the component ' s security points to access current data.
Answer:
AExplanation:
Data in the warehouse is only as current as its last load, which is why a SlicerDicer-based component can appear behind the operational system. The scenario is resolved as follows: increase ETL frequency to update Caboodle and verify the session ' s data source. Chronicles is the transactional database, and its content reaches Clarity and then Caboodle through scheduled processes, so a delay between an event and its appearance in the component is expected unless the schedule is shortened. Other changes, such as new filters, a new report group or a rebuilt session, affect who sees the content or how it is grouped, and they leave the underlying freshness unchanged. The analyst should confirm the existing schedule, review the logs for errors that could be leaving rows behind and then request an adjustment from the administrator. It is wise to document the expected latency on the dashboard itself. A reader who understands that the figures are updated overnight, for example, will not mistake the lag for a defect, and the number of support requests falls accordingly.
Jason adds filters to display only patients seen in Cardiology. What is the correct method?
Options:
Use the Criteria tab
Click the Filters toolbar button, select column, and apply value
Manually sort columns and remove data
Add a new parameter to the model
Answer:
BExplanation:
To display only patients seen in Cardiology in a report that has already been run, the user clicks the Filters toolbar button, selects the column and applies the value. The results are then reduced to the rows with that value, without the report being run again. The second option is correct. The Criteria tab defines the search and would require the report to run again, so it is not the method for refining existing results. Manually sorting columns and removing data is unreliable and is not how the tool is intended to be used. Adding a new parameter to the model would be a development change affecting the template and not a task for a user in the Results Viewer. Filtering is a quick way to explore the results, for example to focus on one department or status, and the filters can be changed or cleared as needed. They affect only what is displayed and leave the underlying results intact. If a user needs the filtered view regularly, the criteria of the report can be edited so that the search itself returns only the relevant patients.
Creating a new SlicerDicer component from an existing one using the Explore Detail option will add the new component to the source dashboard.
Options:
True
False
Answer:
BExplanation:
The statement is false. Creating a new SlicerDicer component from an existing one by using the Explore Detail option does not add the new component to the source dashboard. The option opens a session based on the existing component so that the user can investigate it further, and any component that results is a separate piece of content. Placing it on a dashboard requires a deliberate step, and changes to a source dashboard can be made only by someone who has the appropriate access to edit it. This protects the dashboard from unintended changes by users who explore the data. It also means that a user who wants to keep an exploration should save it as a personal session, or ask the dashboard owner to incorporate it. The distinction between exploring and editing is important for governance, because source dashboards are designed for a defined audience, and uncontrolled additions could break the principle that every component on a dashboard must work for everyone in that audience.
Lisa wants to count the number of visits per provider in a Workbench summary. Which of the following should she do first?
Options:
Add a new INI item
Choose the correct grouping and summarization function
Build a SQL metric
Add a badge for each result row
Answer:
BExplanation:
To count the number of visits for each provider in a Workbench summary, Lisa should first choose the correct grouping and summarization function. The grouping determines the level at which the data is combined, which here is the provider, and the summarization function determines what is calculated for each group, which here is a count of visits. Together they produce the result that she wants. The second option is correct. Adding a new INI item would be a change to the underlying database and is not required. Building a SQL metric is unrelated to a Workbench summary. Adding a badge for each result row would highlight values but would not produce the count. In the Summary tab, the PAF columns define the fields used for grouping and summarization, so Lisa should select the provider column for grouping and the visit column with a count function. After running the report, she should check that the totals are plausible, because an incorrect grouping or function can misrepresent the data, and she may then present the results as a table or chart.
Which of the following fields would be appropriate to use as a criterion?
Options:
Gender
PCP count
Dashboard link
Component title
Answer:
AExplanation:
A criterion defines a condition about the people or records in the population, so it must be a data field that describes them. Gender is an attribute of a patient that can be used to include or exclude records, which makes it an appropriate criterion. The count of primary care providers is a calculated quantity and would be suited to use as a measure, if offered by the model, not as a condition for inclusion. A dashboard link and a component title are Radar configuration elements. They describe how content is presented to users and are not data fields in a SlicerDicer data model, so they can neither be selected as criteria nor used to define a population. The question reflects a broader principle that the fields offered by SlicerDicer come from the data model and relate to the subject of the analysis, such as demographics, diagnoses, encounters or orders. When a field that a user expects is unavailable as a criterion, the analyst should check whether the current model contains it, and if not, whether another model or a Caboodle extension is needed.
In advanced, a SlicerDicer population with multiple criteria and custom measures from extended FDM shows discrepancies when compared to a Clarity query on the same tables. What advanced to align?
Options:
Verify the FDM mappings and Clarity views for the extended fields; adjust ETL if needed
Use standard models only
Ignore, use Clarity
Recreate FDM
Answer:
AExplanation:
When a SlicerDicer population with several criteria and custom measures shows discrepancies compared with a Clarity query on the same tables, the first task is to verify how the data model maps the fields and how those fields relate to the Clarity views. Differences commonly arise because the model applies filters, joins or definitions that differ from those in the query, or because an extended field is extracted differently. If the mapping is wrong, the ETL may need to be adjusted. The first option is correct. Using only standard models avoids the question without resolving it. Ignoring the discrepancy and relying on Clarity would leave users with inconsistent figures. Recreating the model from scratch is a drastic step that may reproduce the same fault. The analyst should compare the counts at each stage, beginning with a simple population and adding criteria one by one until the difference appears, which locates the cause. Documenting the final reconciliation helps others to understand why the two tools sometimes give different values, for example because of differing time windows or inclusion rules.
What is an HRX Record?
Options:
A workbench report, a slicerdicer session, or one of the many other application reports stored in HRX.
A database table
A security class
A user profile
Answer:
AExplanation:
An HRX record stores a Workbench report, a SlicerDicer session or one of the many other application reports held in the HRX master file. It contains the definition of the report, including the template it came from, the criteria, the display columns and other settings, and it is what a user opens when they run a saved report from the Library. The first option is correct. A database table is a relational object belonging to Clarity or Caboodle and is not a record in the Chronicles master file. A security class defines the actions that a user may perform. A user profile is held in a different master file. The HRX master file explains why a saved SlicerDicer session behaves like a report: it is stored in the same type of record. This is also why a session must be saved before it can be used as the source of a Radar component, since the component refers to the stored record. Analysts who need to investigate a missing or misbehaving report can examine its HRX record.
A Radar dashboard, enabled and Ready for Use, is not visible to a specific user group, and its SlicerDicer-based components lack interactivity and display outdated data. The components have valid Hyperspace activity links, but drill-down fails for some users. What should the administrator investigate and resolve?
Options:
The dashboard ' s Access form for user group Report Groups, users ' security points for interactivity, ETL frequency for Caboodle, and activity link security points.
The components ' Display Titles, data sources, and SlicerDicer session filters in the Component Editor.
The SlicerDicer sessions ' data extraction to Caboodle and activity descriptor registration in Chronicles.
The dashboard ' s Owning Application, session rebuild in Clarity, and user personalization settings.
Answer:
AExplanation:
When a dashboard opens but its components cannot be clicked or used by some people, the fault lies with the permissions of those people. The correct item to verify is: the dashboard ' s Access form for user group Report Groups, users ' security points for interactivity, ETL frequency for Caboodle, and activity link security points. Interaction with a component, such as drilling down or selecting a value, depends on security points that must be present in the user ' s class, and a user who can only view will see the content without being able to act on it. The data source, the session connection and the layout would affect every user equally. The developer should compare an affected user with one for whom the dashboard works, identify the missing points and ask the security administrator to add them where appropriate. This is consistent with the Radar principle that every user in the audience must have the security to use every component. Testing again after the change confirms that the behavior is now correct.
When tracing a report, what kind of information is typically gathered?
Options:
Template metadata
Search logic, index usage, query steps, and timing
User login information
Number of rows in Clarity
Answer:
BExplanation:
A trace of a Workbench report gathers information about how the search was carried out. This includes the search logic that was applied, which indexes were used, the individual query steps and the time taken by each. The second option describes this. Template metadata is information about the report definition and is available through other means. User login information is an audit matter. The number of rows in Clarity is not relevant, since Workbench reports search Chronicles. With the trace output, an analyst can determine where time is being spent. For example, if a search has to scan a large number of records because a criterion uses a non-indexed item, the analyst can change the criterion to use an indexed item, or can add a narrower date range so that fewer records are examined. The trace therefore supports tuning of reports, which is especially important for operational reports that users run frequently and expect to return quickly. It should be applied for diagnosis and switched off in routine use.
What is the difference between a Template and a Report in Epic Reporting Workbench?
Options:
There ' s no difference
A Template defines what can be searched; a Report defines what is being searched
A Report defines columns; a Template is a SQL script
A Report runs automatically; a Template doesn ' t
Answer:
BExplanation:
A template defines what can be searched, and a report defines what is actually being searched. The template establishes the master file, the criteria that are available and the display columns that can be used, and it is built and configured by developers. A report is created from the template by a user who selects specific parameters and columns, so it represents a particular question asked of the data. The second option is correct. The statement that there is no difference is false. A report does not define columns while the template is a SQL script, because Workbench searches Chronicles and does not rely on SQL scripts. A report does not run automatically while a template does not, as this confuses the distinction with scheduling. Understanding the relationship allows a user to appreciate that many reports can be built from one template, and that changes to the template can affect them. The user works within the options that the template provides, and if the information required is not offered, the template or the columns must be extended by a developer.
To enable advanced benchmarking in a metric component for a custom metric, ensure the IDN record is aligned with GPIN, but for organization-specific customizations, what additional?
Options:
Map the custom metric to a GPIN equivalent and submit for community inclusion
No custom benchmarking
Local only
Use SlicerDicer benchmark
Answer:
AExplanation:
To enable benchmarking for a custom metric, the IDN record is aligned with the GPIN structure. For a customization that is specific to the organization, the additional step is to map the custom metric to an equivalent GPIN item and to submit it for inclusion in the community. Mapping it allows the metric to be compared with the same measure at other organizations, and submitting it makes it available to the community so that others can also contribute data. The first option is correct. Stating that custom metrics cannot be benchmarked is inaccurate, and a local-only approach would give up the comparison. SlicerDicer does not provide a separate benchmarking facility for this purpose. Before submitting, the developer should ensure that the definition is clear and consistent, since a metric that is calculated differently from the community definition would lead to misleading comparisons. Coordinating with Epic and with the other organizations involved helps to agree on a common definition. Once benchmarking is available, the component can show the community value alongside the local result.
An analyst designs a Reporting Workbench report to monitor post-surgical complications, grouped by procedure type and surgeon, with a custom calculated column for complication rates using Chronicles data. The report must be restricted to surgical quality teams, include a trace log, support Epic benchmarking export, and allow dynamic filtering by hospital wing. Which configuration meets these requirements?
Options:
Use a Cogito SQL template for the calculated column, assign a Report Group for quality teams, enable trace logging, set Chronicles as the data source, configure benchmarking export, and add a wing-based filter in Report Settings.
Build the report in Clarity, restrict access via Action Groups, enable ad hoc searches, link to a SlicerDicer session for benchmarking, and disable trace logging.
Create a SlicerDicer session for complications, set security points for quality teams, configure summary targets, and add wing-based slices.
Configure the report in Caboodle, assign user roles in Hyperspace, enable benchmarking filters, and add a custom column in SlicerDicer.
Answer:
AExplanation:
A calculation that must be based on Clarity data is built with a Cogito SQL template. The correct configuration here is: use a Cogito SQL template for the calculated column, assign a Report Group for quality teams, enable trace logging, set Chronicles as the data source, configure benchmarking export, and add a wing-based filter in Report Settings. The template lets the developer write the SQL that retrieves and calculates the value, including aggregate functions such as averages and calculated columns such as scores, and the report then displays it like any other column. A SlicerDicer session offers only the filters and measures defined in its model, a summary target in Chronicles belongs to a different mechanism, and an action group controls access and not calculation. The developer should confirm which Clarity tables hold the necessary data, write and test the query on a small population and then examine performance on realistic volumes. The result should be reconciled with a trusted figure, since an incorrect join can inflate counts, and the logic should be documented so that colleagues can maintain it.
Shared SlicerDicer sessions are typically:
Options:
Editable by both sender and receiver
Read-only for the recipient
Auto-converted into Radar components
Scheduled for daily refresh
Answer:
BExplanation:
Shared SlicerDicer sessions are read-only for the recipient. The sender maintains control of the original analysis, and the recipient can view and explore it but cannot save changes to it. This arrangement avoids accidental or unauthorized changes and ensures that the analysis the sender intended is preserved. If the recipient wants to alter the population or the measures, they can create a copy and modify that. Editing by both sender and receiver would conflict with the read-only design and could cause the shared analysis to change unexpectedly. Shared sessions are not converted automatically into Radar components. A component is created deliberately by a developer in the Component Editor, which uses a saved session as its data source. Daily refresh scheduling is not part of sharing, either, because the data is refreshed according to the warehouse load schedule and not by the session. The recipient ' s view is also subject to their own security, so differences in what they see compared with the sender may be due to access. This should be considered when a recipient questions a number.
A dashboard component requires row-specific threshold indicators for a table displaying department performance metrics. Which Component Editor setting enables this?
Options:
Enable Threshold Overrides on the Output Format form.
Set the Summary Target Lookup Method to " Dynamic. "
Configure the data source as Reporting Workbench.
Add a slice in the SlicerDicer session.
Answer:
AExplanation:
For a table that displays department performance metrics and needs a threshold indicator that differs for each row, the setting to use is Threshold Overrides in the Output Format form of the Component Editor. Each department may have its own target, so a single threshold for the whole table would flag some rows incorrectly. The overrides let the developer define limits for individual rows, and the indicator then reflects the right comparison for each department. The first option is correct. The Summary Target Lookup Method, chosen in a different place, determines how targets are obtained, not how row-specific indicators are displayed. Choosing Reporting Workbench as the source does not address thresholds. Adding a slice to a SlicerDicer session changes the grouping and not the indicator. The developer should ensure that the override values match the targets that have been agreed with the departments, and should document where they are maintained so that they can be updated. After configuring the table, testing values on each side of the limits confirms that the indicators change at the right points.
How do you limit summary levels available to users on a dashboard?
Options:
By editing the CSF record
Use Resource Settings in Dashboard Editor and select override options
Through Reporting Workbench template
With the IDN summary file
Answer:
BExplanation:
Summary levels available to users on a dashboard are limited by using the Resource Settings form in the Dashboard Editor and selecting the override options. The form allows the developer to override the defaults that come from the dashboard resource, such as which levels are selectable and where the dashboard starts, so that the dashboard offers only what is appropriate for its audience. The second option is correct. Editing the CSF record would alter stored metric values, which would be inappropriate and does not control the levels offered. A Reporting Workbench template is irrelevant to metric dashboards. The IDN summary file defines the levels themselves, and changing it would affect every dashboard that uses them, which is not what is wanted when the goal is to limit a single dashboard. Using overrides is the approach that keeps the change local. The developer should test the dashboard after the change to confirm that users can still reach the levels they need, and should consider the Parameter Settings, which define the summary targets that may be chosen within each level.
What does a Master File (INI) contain?
Options:
Information about a single subject, like patients or orders
All SQL tables for Clarity
Settings for dashboards
Clarity and Caboodle dictionaries
Answer:
AExplanation:
A master file, identified by a three-letter initialism known as the INI, contains information about a single broad subject, such as patients, orders or users. Each master file holds the records for that subject, and everything that Chronicles stores is organized within one master file or another. The first option states this. A master file does not contain all the SQL tables of Clarity, because Clarity is a separate relational database. It does not hold settings for dashboards, which are stored in records of their own master files that are used by Radar. It also does not contain the Clarity and Caboodle dictionaries, which are documentation resources outside Chronicles. The INI is one half of the address used to find any item, the other half being the item number, so an expression such as I EPT 10110 refers to item 10110 in the EPT master file. Analysts use this addressing when searching the Data Dictionary, where each column ' s Chronicles information lists the master file and the items that populate it.
You are building an advanced Reporting Workbench template that incorporates sub-reports for nested data, such as patient encounters with embedded procedure details. To display this in a hierarchical format without multiple runs, what feature in the Report Settings would you use?
Options:
Grouped summaries with expandable sections in the Summary tab
Linked components in a dashboard for sub-reports
Custom PAF columns for nested queries
Explore tab visualizations for hierarchy
Answer:
AExplanation:
To display nested data, such as patient encounters with embedded procedure details, in a hierarchical format without running the report several times, the developer uses grouped summaries with expandable sections in the Summary tab. The results are grouped by the parent level, here the encounter, and the details are displayed beneath each group, so the user can expand a section to see the procedures. This delivers the hierarchy from a single run. The first option is correct. Linked components in a dashboard for sub-reports would require multiple sources and would not present the data as a single hierarchical report. Custom PAF columns for nested queries do not exist as a mechanism for producing hierarchies. Explore tab visualizations for hierarchy would produce charts after the report has run, but they do not build the nested structure into the report. The grouped summary approach keeps the design within the template and gives users a coherent view. The developer should choose the grouping field carefully, so that each group is meaningful, and test the report with encounters that have many procedures to check readability.
Which of the following is NOT possible while using Proxy Mode?
Options:
Running reports
Viewing Library layout
Viewing dashboard structure
Verifying user preferences
Answer:
AExplanation:
Running reports is not possible while in Proxy Mode. The mode lets the analyst view the Library layout, the structure of dashboards and the user ' s preferences, so that problems of access and configuration can be diagnosed, but it prevents actions that would execute a search under the other user ' s identity. Running a report could return data that the analyst is not entitled to view, which is why it is restricted, and for the same reason the data in dashboard components is not displayed. The correct answer is the first option. Viewing the Library layout and the dashboard structure are both permitted, as they show configuration and not the user ' s data. Verifying user preferences is also possible, since the preferences describe how the user has set up their environment. Recognizing these boundaries helps the analyst plan troubleshooting. If a report fails for a user, the analyst can use the mode to confirm that the report is in the Library, and can then ask the user to run it and describe the result, or can run it under their own account to confirm that the template functions.
Where does Jason go to create a new report from a template in Hyperspace?
Options:
Result Viewer
Library tab in My Reports
Epic Button > Utilities
Reporting Module > Report Model Wizard
Answer:
BExplanation:
In Hyperspace, a user creates a new report from a template in the Library tab under My Reports. The Library lists the templates that are available to the user, based on the report groups they share, along with existing reports, and from it the user can choose a template and start building a new report. The second option is correct. The Result Viewer displays the results of a report that has been run and is not the place to create one. The Epic button and the Utilities menu give access to general functions and are not the route for creating reports. A Report Model Wizard under a Reporting Module is not the navigation path for this task. After selecting a template, the user chooses the parameters and display columns, runs the report to check the results and then saves it, so that it appears in the Library for later use. Whether the saved report is private or public determines who else can see it. If the expected template is not displayed in the Library, the analyst should check the template ' s configuration and the user ' s report groups.
A user with appropriate security roles can view a Radar dashboard but cannot post to its collaborative feedback component, despite other users posting successfully. The dashboard is accessible via the Analytics Catalog, and the component is enabled. The user also reports no drill-down capability. What should the administrator do to resolve these issues?
Options:
Add the user to the Feedback Authors list in the Component Editor ' s Collaborative settings and configure a Hyperspace activity link for drill-down.
Assign a new Action Group to the user ' s Hyperspace profile and update the component ' s data source.
Enable the " Post Feedback " security point and verify the dashboard ' s Layout form for interactivity.
Update the dashboard ' s Access form to include the user ' s Report Group and rebuild the SlicerDicer session.
Answer:
AExplanation:
Contribution to a collaborative dashboard component is a controlled privilege. A user who can read but not write is probably outside the component ' s authorized list. The correct solution is: add the user to the Feedback Authors list in the Component Editor ' s Collaborative settings and configure a Hyperspace activity link for drill-down. The setting resides in the Component Editor and is evaluated in addition to the user ' s roles. Modifying their action groups, the dashboard ' s access or a session would not extend this privilege. The developer should confirm with the owner that the user should have the right, update the list and test with the user ' s account. The control exists to keep official channels, such as announcements or feedback, free from unmanaged posts, so the list should be small, current and reviewed whenever responsibilities change. Where several settings could plausibly be responsible, changing one at a time and retesting after each change makes it possible to learn which setting actually solved the problem, which is useful knowledge for later maintenance.
A dashboard component must display a trend line for patient admissions over time. Which configuration supports this?
Options:
Use Dashboard Resources and configure a line graph in the Component Editor.
Create a SlicerDicer session with a time-based filter.
Set the data source to Clarity and enable summary targets.
Assign a new Report Group for trend analysis.
Answer:
AExplanation:
A chart component that shows a particular type of graph, such as a bar, pie or line chart, is configured in the Component Editor with the dashboard resources as its data source. The correct configuration is: use Dashboard Resources and configure a line graph in the Component Editor. The data source supplies the values, and the display format determines how they are drawn, so the developer selects the chart type that matches the question: bars for comparing categories, a pie for the parts of a whole with few categories, and a line for a trend over time. The alternatives place the work in a session, in a summary target or in a report group, none of which creates the display. After configuring the chart, the developer should test it with real data, check the labels and the axes, and make sure that the audience has access to the component through the dashboard ' s report groups.
A Reporting Workbench report must calculate average wait times by clinic using Clarity data. How should this be configured?
Options:
Use a Cogito SQL template with an aggregate function in Clarity.
Create a SlicerDicer session with wait time filters.
Configure a summary target in Chronicles.
Assign a new Action Group for data access.
Answer:
AExplanation:
A calculation that must be based on Clarity data is built with a Cogito SQL template. The correct configuration here is: use a Cogito SQL template with an aggregate function in Clarity. The template lets the developer write the SQL that retrieves and calculates the value, including aggregate functions such as averages and calculated columns such as scores, and the report then displays it like any other column. A SlicerDicer session offers only the filters and measures defined in its model, a summary target in Chronicles belongs to a different mechanism, and an action group controls access and not calculation. The developer should confirm which Clarity tables hold the necessary data, write and test the query on a small population and then examine performance on realistic volumes. The result should be reconciled with a trusted figure, since an incorrect join can inflate counts, and the logic should be documented so that colleagues can maintain it.
A Cogito SQL report, sourced from Clarity, groups inpatient stays by ward and calculates average length of stay, with a trace log. The report is restricted to ward managers. Which configuration is correct?
Options:
Use Clarity, group via the Display tab, enable trace logging, and assign a Report Group for ward managers.
Build in Chronicles, configure summary targets, disable trace logging, and set security points.
Create in SlicerDicer, add ward slices, enable ad hoc searches, and restrict via Action Groups.
Use Caboodle, assign user roles in Hyperspace, and configure Dynamic Thresholds.
Answer:
AExplanation:
A SQL-based report that summarizes Clarity data by category and tracks its own use has a well-defined configuration. The answer to this scenario is: use Clarity, group via the Display tab, enable trace logging, and assign a Report Group for ward managers. Using Clarity ensures access to the historical relational data, defining the grouping in the Display tab sets the level of summary, and enabling the trace log supports review and accountability. Assigning the report group limits it to the people who should see it. Alternatives using Chronicles, SlicerDicer or Caboodle do not satisfy the combination of requirements. Before release the developer should examine the SQL for efficiency, verify the totals against a trusted source and ask a member of the target group to run it. The nightly refresh of Clarity should be mentioned in the report description, so that readers know how current the figures are. After the correction, a comparison with an independent source, such as an operational list or a known total, confirms that the output is complete and that no secondary problem remains hidden behind the first.
A provider wants to compare the number of well-child visits by provider. You should:
Options:
Use a measure for " Well-Child Visits " and slice by Provider
Create a Radar panel
Run a chart review
Export to Excel and sort
Answer:
AExplanation:
To compare the number of well-child visits among providers, the analyst needs a measure that counts the visits and a slice that groups the results by provider. The first option describes this configuration. The measure defines what is calculated, which here is the number of well-child visits, and the slice divides the data so that a value is shown for each provider. Creating a Radar panel would not analyze the data, since Radar presents content that has already been built, though a saved session could later be placed on a dashboard. Running a chart review is a clinical activity for examining an individual patient ' s chart and does not support population analysis. Exporting to Excel and sorting would be a manual alternative that increases effort and may introduce errors, and it would be unnecessary when the tool can produce the comparison directly. A bar graph is the best choice to display the result because it allows the lengths of the bars to be compared. If necessary, a criterion can be added for the date range so that all providers are compared over the same period.
How is the Analytics Catalog different from the Reporting Workbench Library?
Options:
The Catalog stores only SQL-based reports
The Catalog spans multiple Epic tools, while the Library shows only reports accessible to the user
The Library includes SlicerDicer, while the Catalog does not
The Catalog replaces the Report Repository
Answer:
BExplanation:
The Analytics Catalog differs from the Reporting Workbench Library in its scope. The catalog spans multiple Epic tools, so it can show Workbench reports, Radar dashboards, components and Epic-Crystal reports in one place. The Library is specific to Reporting Workbench and lists only the reports that the user has access to. This is the second option. The catalog is not limited to SQL-based reports, and its content includes several types. The Library does not include SlicerDicer sessions, so the third option reverses the facts. The catalog does not replace the Report Repository, which is a separate resource maintained by Epic that lists Epic-released content. The distinction helps users decide where to look. A person who wants to run or manage Workbench reports works in the Library, whereas a person who is unsure whether a report, dashboard or component already exists should search the catalog. Both views reflect the user ' s access, but the catalog offers broader discovery, and its search relies on the quality of tags and descriptions.
You are reviewing the PAT_ENC_HSP table in the Data Dictionary and are unsure of the purpose of the BILL_NUM column in this table. How can you use the Data Dictionary to find more information?
Select one of the following (1 PT)
Options:
Find the Category list table for BILL_NUM
Open BILL_NUM in the Item Editor
Read the Description for BILL_NUM
Read the Overview for PAT_ENC_HSP
Answer:
CExplanation:
The question asks about the purpose of one specific column, and the Data Dictionary documents that purpose in the column ' s own Description. Opening the BILL_NUM entry reveals what the value represents, how it is populated and any caveats, together with its data type and Chronicles Info. This is the targeted source and is therefore the correct step. The table Overview for PAT_ENC_HSP explains the purpose and grain of the table as a whole, which is useful context but typically does not explain an individual column. A category list table is relevant only to category columns, whose names end in _C and which have a ZC_ lookup; the name BILL_NUM suggests a plain identifier or number, so there would be no category list to find. The Item Editor is a Chronicles tool, and the question restricts the approach to the Data Dictionary. Even outside that restriction, the Item Editor would describe the source item rather than the Clarity column. Efficient research proceeds from the specific to the general: read the column description, check the Chronicles Info if the source is unclear, and consult the table overview only if the surrounding context is needed.
A dashboard component fails to open a linked Hyperspace activity for some users, despite a valid activity descriptor. The component uses Dashboard Resources. What is the cause?
Options:
The users lack security points for the Hyperspace activity in their security class.
The component ' s data source is misaligned with the SlicerDicer session.
The dashboard ' s Layout form restricts interactivity.
The activity descriptor is not enabled in Chronicles.
Answer:
AExplanation:
A link to a Hyperspace activity works only for people who are permitted to open that activity. When administrators succeed and other users fail despite a valid descriptor, the difference is security. The correct explanation is: the users lack security points for the Hyperspace activity in their security class. The descriptor tells Radar which activity to launch, but it does not grant the right to use it, so each user ' s security class must include the necessary points. The other options look at the data source, the layout or the registration of the descriptor, none of which would produce a failure that affects only some users. The developer should compare the security class of a user who can open the link with that of one who cannot, identify the missing points and ask the security administrator to add them if the audience is meant to have the access. If the activity should not be available to everyone, the dashboard ' s audience should be narrowed instead. This follows the principle that every user of a dashboard must be able to use every component on it.
In Chronicles, which structure is at the top of the hierarchy?
Options:
Master File
Record
Contact
Line
Answer:
AExplanation:
The master file is at the top of the Chronicles hierarchy. Each master file holds information about a broad subject, such as patients, users or orders, and is identified by a three-letter initialism. Beneath it are records, each representing one entity within the master file. A record may be divided into contacts, which are dated snapshots, and the data itself is stored in items, which can contain lines when they hold several values. From broadest to narrowest the order is therefore master file, record, contact, item and line. The first option is correct, while the others are all lower-level structures. Knowing the hierarchy is essential for reading the Data Dictionary, which identifies the source of each Clarity column by master file and item, and for using the Record Viewer, which requires the master file, the record and, where relevant, the contact to be specified. It also helps explain the structure of Clarity primary keys, in which record identifiers, contact serial numbers and line numbers reflect these levels.
A Radar dashboard component, linked to a SlicerDicer session using the Encounters data model, displays outdated patient discharge data from Caboodle and lacks drill-down to discharge summaries. Some users report inconsistent threshold indicators and no export capability. How should the analyst resolve these issues?
Options:
Increase ETL frequency to update Caboodle, configure a Hyperspace activity link for drill-down, enable User-Specific Threshold Overrides, and add export in Component Settings.
Switch the session to Chronicles for real-time data, rebuild the session, and update security points for thresholds and export.
Assign a new Report Group to align the session, rebuild in Clarity, and configure summary targets for export.
Rebuild the session in Hyperspace, disable drill-down, and update the component ' s data source for export.
Answer:
AExplanation:
Warehouse-based content depends on the extract and load cycle. If a component shows data that is out of date or missing recent records, the first place to look is how often Caboodle is refreshed. The recommended solution here is: increase ETL frequency to update Caboodle, configure a Hyperspace activity link for drill-down, enable User-Specific Threshold Overrides, and add export in Component Settings. The reason is straightforward. SlicerDicer queries Caboodle, Caboodle is populated from Clarity, and Clarity is populated from Chronicles, so each stage adds time between a clinical event and its visibility. Rebuilding the session, assigning report groups or editing filters does not shorten that chain, and a switch to real-time Chronicles data is not how this tool works. Before requesting a change, the developer should verify that the loads are completing, because a failed job produces the same symptom as an infrequent one. After the schedule is adjusted, the component should be checked again against a trusted source for the most recent day, to confirm that the gap has closed and that no records are still absent.
Maria needs to find a component related to chronic kidney disease for her Radar dashboard. What ' s her first step in the Report Repository?
Options:
Create a new report from scratch
Open Clarity SQL Editor
Search using keywords like " chronic kidney disease " in the Repository
Submit a help ticket to Epic
Answer:
CExplanation:
When a developer needs a component related to chronic kidney disease for a Radar dashboard, the first step in the Report Repository is to search using keywords such as chronic kidney disease. The Repository is organized so that content can be located by keyword, and a search quickly shows whether Epic has already released something suitable. The third option is correct. Creating a new report from scratch would waste effort if appropriate content already exists, so it should come only after the search. Opening the Clarity SQL Editor is unrelated to discovering released content. Submitting a help ticket to Epic would be unnecessary, since the Repository is a self-service resource. After the search, the developer can review the summary and additional details of the results, decide which item fits and then plan how to implement it in the organization ' s environment. If nothing suitable is found, building a custom component becomes the appropriate course. Starting with the search is efficient and follows the principle of reusing delivered content wherever possible.
A Cogito analyst configures a Radar dashboard with a component that displays patient satisfaction scores, sourced from a SlicerDicer session. The component must allow drill-down to individual patient records and restrict access to department managers. Which steps ensure the component meets these requirements?
Options:
Configure the component with a Hyperspace activity link, set the data source to Dashboard Resources, and assign a Report Group.
Enable drill-down in SlicerDicer, set security points in Hyperspace, and mark the dashboard as Ready for Use.
Add the component to the Analytics Catalog, configure Clarity as the data source, and restrict access via Chronicles.
Create a new SlicerDicer session, enable user personalization, and assign Action Groups to managers.
Answer:
AExplanation:
For a component that displays patient satisfaction scores from a SlicerDicer session, allows drill-down to individual patient records and is restricted to department managers, the configuration has three parts. The component is set up with a link to a Hyperspace activity so that users can open the record of the patient behind a row. Its data source is set to the dashboard resources, which is how the component obtains the session data in a controlled way. A report group is assigned so that access is limited to the managers who belong to it. The first option is correct. Enabling drill-down within SlicerDicer itself does not create the activity link, and security points in Hyperspace alone do not restrict the component. Adding the component to the catalog or choosing Clarity as the source does not satisfy the requirement, and Chronicles is not where the restriction is applied. Action groups are not the mechanism for assigning access to a component. After configuring it, the developer should test with a manager and a non-manager to confirm the intended behavior.
An advanced Reporting Workbench template with parameters for multi-select departments needs to generate sub-summaries per department in one run. What feature?
Options:
Use looped summaries in Summary tab for multi-select iteration
Separate reports
Post-run filters
Dashboard combination
Answer:
AExplanation:
When a Workbench template accepts several departments through a multi-select parameter and a separate sub-summary is needed for each one in a single run, the Summary tab is configured with a looped summary that iterates over the selected values. Each pass produces the summary for one department, so the user receives all the results together without running the report repeatedly. The first option is correct. Building separate reports would multiply the effort and make maintenance harder. Post-run filters could narrow the results after the report has run but would not generate a distinct summary for each selection. Combining the output on a dashboard would require several components and sources and would not meet the need within the report itself. The developer should test the report with a single department, with several and with all of them, and check that the totals are consistent. Performance should also be considered, because the report searches Chronicles once for each iteration. Efficient criteria help, and the report should not be offered for a very large number of selections without testing.
How can you view data grouped by a field like " Primary Care Provider " ?
Options:
Change your visualization to a pie chart
Add a Slice for " PCP "
Apply a Filter
Run a backend SQL report
Answer:
BExplanation:
To see data grouped by a field such as Primary Care Provider, the user adds a slice for that field. The slice divides the population into one subgroup per provider and the measure is calculated for each, so that the groups can be compared. This is why the second option is correct. Changing the visualization to a pie chart alters only the appearance of the results and does not produce any grouping by provider. A filter restricts the population to those who meet a condition, so applying a filter on provider would show one provider ' s patients but not a comparison among all providers. Running a backend SQL report is not necessary for this requirement and is not a SlicerDicer function, as the tool is intended to let users explore the data without writing queries. The example is a common one in practice. A clinic manager might look at the proportion of patients with controlled blood pressure for each provider, and the slice makes that comparison possible in a few clicks. The user should keep in mind that slicing does not exclude anyone, so the totals across the groups equal the size of the population.
A SlicerDicer session fails to return data for a dashboard component despite correct filters. The session uses the Patients data model. What is the likely issue?
Options:
The data is not extracted to Caboodle.
The session is linked to an incorrect Report Group.
The component ' s security settings block data access.
The Patients data model is not enabled in Hyperspace.
Answer:
AExplanation:
A SlicerDicer session that returns nothing despite correct filters most often lacks data in its source. The explanation for this scenario is: the data is not extracted to Caboodle. SlicerDicer reads from Caboodle, so if the relevant data has not been extracted and loaded, there are no rows for the criteria to select, however carefully they are written. Report group assignments and component security would hide a component or block access, but they would not cause an empty result for users who can see it. A data model that is disabled would prevent the session from opening and is not suggested by the symptoms. The developer should check that the source tables are populated in Clarity, that the extract for them is scheduled and that the warehouse load completes without errors. Testing the session with a simple population and no criteria is a useful step, because it shows whether any data exists at all and separates a load problem from a criteria problem.
A women ' s health provider wants to identify all patients aged 50-75 who are overdue for mammograms. What would you do in SlicerDicer?
Options:
Filter by gender, age, and screening status
Use Output Format in the dashboard
Access Radar and launch the badge viewer
Export appointment data
Answer:
AExplanation:
To identify women aged fifty to seventy-five who are overdue for mammograms, the analyst defines the population by applying filters for gender, age range and screening status. Each condition narrows the group, and the result is the set of patients who meet all of them. This is the first option. Output Format is a setting in the Component Editor for building dashboard components and does not select patients. Launching a badge viewer in Radar relates to highlighting values in a table component and does not define a population. Exporting appointment data would provide a list of appointments but not identify patients who are overdue for a screening, and it would add manual work. The SlicerDicer approach allows the provider to see the size of the population immediately and to refine the conditions if the count is unexpected. The user can then add a slice, for example by clinic or provider, to direct outreach to the right teams, and can save the session so that it can be rerun as the data is refreshed each night.
A Cogito SQL report, sourced from Clarity, groups inpatient admissions by diagnosis-related group (DRG) and calculates multiple metrics (e.g., average cost, length of stay), with a trace log for debugging. The report must be restricted to financial analysts and support export to Epic ' s benchmarking database. Which configuration is correct?
Options:
Use Clarity, group via the Display tab, enable trace logging, assign a Report Group for financial analysts, and configure benchmarking export in Report Settings.
Build in Chronicles, configure summary targets, disable ad hoc searches, set security points, and enable benchmarking filters.
Create in SlicerDicer, add DRG slices, enable trace logging, restrict via Action Groups, and link to Clarity.
Use Caboodle, assign user roles in Hyperspace, configure Threshold Overrides, and enable benchmarking in SlicerDicer.
Answer:
AExplanation:
When a report must aggregate Clarity data, record its execution and restrict its audience, the configuration has several parts that work together. The scenario is resolved by this: use Clarity, group via the Display tab, enable trace logging, assign a Report Group for financial analysts, and configure benchmarking export in Report Settings. Clarity is the proper source for SQL reporting on historical data, grouping and functions are defined in the Display tab, and trace logging provides an audit trail that is particularly valuable where the report concerns sensitive operational information. The report group keeps the report within its intended audience. Alternatives based on Chronicles, SlicerDicer or Caboodle either change the platform or combine unrelated settings. After building the report, the developer should schedule it to avoid peak extract times, validate the figures and confirm that a user outside the group cannot find or run it. After the correction, a comparison with an independent source, such as an operational list or a known total, confirms that the output is complete and that no secondary problem remains hidden behind the first.
What does the Base represent in SlicerDicer?
Options:
A list of default report settings
The initial population before criteria and filters are applied
The lowest permission level for analysts
A dashboard template for population data
Answer:
BExplanation:
The base is the first choice a user makes after selecting a data model, and it represents the initial population before any criteria or filters are applied. Using a model of procedure orders as an example, the base might be all orders or only the orders that the user placed. Every later criterion narrows that starting group, so the base establishes the largest set that can possibly be analyzed. This is the meaning in the second option. The first option, a list of default report settings, confuses SlicerDicer with Reporting Workbench. The lowest permission level for analysts is a security concept and has no relationship to the base. A dashboard template for population data refers to Radar and not to the SlicerDicer session. A clear grasp of the base is important because it cannot be enlarged by criteria. If an analysis excludes records that were expected, the first diagnostic step is to examine the base, since it may already be limiting the population before the criteria are considered. Users with different security rights may also see different bases available to them, which can lead to different results for the same session.
A dashboard component ' s colored indicators fail to reflect provider-specific, volume-adjusted thresholds for a table of clinic metrics. The component uses Dashboard Resources and a SlicerDicer session. Some users report no drill-down to provider details. Where should adjustments be made, and what enables drill-down?
Options:
Enable Provider-Volume Dynamic Threshold Overrides in the Component Editor ' s Output Format form and configure a Hyperspace activity link for drill-down.
Update the Summary Target Lookup Method to " Provider-Volume " in the Data Source form and rebuild the session.
Reconfigure the SlicerDicer session with provider and volume slices and enable drill-down in SlicerDicer.
Assign provider-level security points in the dashboard ' s Access form and link to a Reporting Workbench report.
Answer:
AExplanation:
Threshold behavior is part of the component ' s output configuration. For the scenario described, the correct step is: enable Provider-Volume Dynamic Threshold Overrides in the Component Editor ' s Output Format form and configure a Hyperspace activity link for drill-down. This places the logic where Radar expects it, in the Output Format form, and allows each row or context to be compared with an appropriate target. Selecting a different lookup method would change how targets are found, not how they are drawn, and edits to sessions or access settings are unrelated. After making the change, the developer should test the component with values below, at and above each limit and confirm that the indicators change correctly. The thresholds should be reviewed periodically with the business owners, because targets change over time and an outdated limit can mislead users into believing performance is acceptable or poor when it is not. Reviewing the work against the guiding principles for analytics content, namely that the content works, that each part works, that the audience is defined and that the audience has the security it needs, is a reliable final check.
A quality team is investigating readmission rates. They want to compare patients readmitted within 30 days by primary diagnosis. What should they use?
Options:
Criterion = readmission in 30 days + Slice by diagnosis
Filter = discharge disposition + View = table
Line graph of readmits by month
Use User Security to limit access
Answer:
AExplanation:
A quality team comparing patients who were readmitted within thirty days by their primary diagnosis needs a population and a comparison. The criterion for a readmission within thirty days defines the population, and a slice by diagnosis divides it so that the number of readmissions for each diagnosis can be compared. This is the first option. A filter on discharge disposition and a table view would restrict a different set of patients and would not group by diagnosis. A line graph of readmissions by month shows a trend over time, which is a different question from the comparison between diagnoses. Using user security to limit access has no bearing on the analysis and addresses who may see the data. The analysis identifies which conditions are associated with the largest numbers of readmissions, which allows the team to target improvement efforts. A bar graph is appropriate for presenting the result. The team should confirm that the data model is based on encounters or admissions, so that each readmission is counted once, and that the date range matches the review period.
A metric-based Radar dashboard component displays inconsistent infection rates across departments, despite using Dashboard Resources and summary targets. The component is linked to a SlicerDicer session, and the dashboard is enabled. What configuration could cause this, and how should it be resolved?
Options:
The Summary Target Lookup Method is set to " Department-Specific " ; change it to " Global " in the Component Editor.
The SlicerDicer session is not extracted to Caboodle; schedule nightly ETL processes.
Departmental users lack Reporting Workbench security; update their security classes.
The dashboard ' s Access form excludes department Report Groups; add the groups.
Answer:
AExplanation:
Inconsistent figures across departments, regions, shifts or user groups in a component that uses dashboard resources can be a result of how its targets are looked up. The scenario is resolved by this: the Summary Target Lookup Method is set to " Department-Specific " ; change it to " Global " in the Component Editor. A context-specific lookup produces different targets for different viewers, and the component ' s indicators then differ accordingly. This is a design choice and not a fault in the data, but it surprises users who expect the same comparison. The developer should confirm the intention, change the method where a common target is required and verify the thresholds afterward. Other symptoms mentioned, such as a missing activity link, are separate matters and are addressed in the settings that the answer describes. Clear labeling of the target used prevents misunderstanding. It is good practice to record the cause and the correction in the component or report description, so that colleagues who meet the same symptom later can resolve it quickly without repeating the investigation.
How does the Report Repository differ from the Analytics Catalog?
Options:
The Repository is used for real-time data
The Catalog contains only Clarity reports
The Repository is maintained by Epic and shows Foundation System content, while the Catalog helps discover local custom analytics content
The Repository is a tool inside Radar
Answer:
CExplanation:
The Report Repository and the Analytics Catalog address different audiences and content. The Repository is maintained by Epic and presents the Foundation System content that Epic releases, such as reports, dashboards, components, data models and filters, so that an organization can see what is available to adopt. The Catalog helps users discover the content that exists locally in their own environment, including custom analytics. The third option states this distinction. The Repository is not for real-time data, as it is a reference to delivered content. The Catalog is not limited to Clarity reports. The Repository is not a tool inside Radar, since it is accessed through Epic ' s UserWeb site. An analyst who needs a new report should first check the Repository to see whether Epic has already released suitable content, which can reduce build time and promote consistency with other organizations. After adopting or building content, the analyst can rely on the Catalog to make that content discoverable to users in the organization, using tags and descriptions.
A SlicerDicer session in a dashboard component, using the Patients data model, shows incomplete data for readmission rates. The session is correctly configured, but the data is not up-to-date. What is the root cause, and how should it be addressed?
Options:
The data is not extracted to Caboodle; implement regular ETL processes to update Caboodle.
The session uses real-time Chronicles data; switch to Clarity for historical data.
The component ' s security settings restrict data; assign a new Report Group.
The Patients data model is outdated; rebuild the session in Hyperspace.
Answer:
AExplanation:
A SlicerDicer session that returns nothing despite correct filters most often lacks data in its source. The explanation for this scenario is: the data is not extracted to Caboodle; implement regular ETL processes to update Caboodle. SlicerDicer reads from Caboodle, so if the relevant data has not been extracted and loaded, there are no rows for the criteria to select, however carefully they are written. Report group assignments and component security would hide a component or block access, but they would not cause an empty result for users who can see it. A data model that is disabled would prevent the session from opening and is not suggested by the symptoms. The developer should check that the source tables are populated in Clarity, that the extract for them is scheduled and that the warehouse load completes without errors. Testing the session with a simple population and no criteria is a useful step, because it shows whether any data exists at all and separates a load problem from a criteria problem.
What is a Data Model in SlicerDicer?
Options:
A graphical interface for Hyperspace workflows
A database of filters used for personalization
A structured set of data fields organized by topic (e.g., encounters, diagnoses)
A predefined Epic component for dashboards
Answer:
CExplanation:
A data model in SlicerDicer is a structured set of data fields that is organized around a subject, such as patients, encounters, diagnoses or orders. It determines which fields can be used for criteria, slices and measures, and it establishes the unit being counted, which is the granularity of the population. Selecting a data model is therefore the first step in a SlicerDicer session. The third option describes this accurately. SlicerDicer is not a graphical interface for Hyperspace workflows, so the first option is incorrect. A database of filters used for personalization is not what a data model is, and filters are applied within a session after the model is chosen. A predefined Epic component for dashboards confuses the concept with a Radar component, which is a record that can display a saved session but does not define the available data. Choosing a model should be based on the question: patient-level questions use a patient model, whereas questions about visits or orders use models in which those are the units. Using the wrong model is a common cause of misleading counts, since a patient with several encounters appears multiple times in an encounter-based model.
What is a benefit of saving a SlicerDicer session?
Options:
Allows for exporting data as raw SQL
Automatically generates a report for print
Retains all criteria, filters, and slices for later use
Grants admin access to report groups
Answer:
CExplanation:
Saving a SlicerDicer session retains its configuration, including the criteria, filters and slices, as well as the chosen measure and visualization, so the user can return to it later or use it as the foundation for further work. This avoids the need to recreate a complex population each time. The third option expresses this benefit. Exporting data as raw SQL is not a function of saving a session, because SlicerDicer is designed to be used without writing queries. A session does not automatically generate a printable report, though data can be exported or displayed separately. Saving does not grant administrative access to report groups, since access is controlled by security and by the distribution settings of the content. A saved session can be shared with colleagues in a read-only form and can be used as the data source of a graph component on a dashboard, which makes saving a prerequisite for those uses. Users should give sessions descriptive names so that they can be found easily, as a long list of unnamed sessions is difficult to manage and may lead to duplicated effort.
A Cogito SQL report groups patient visits by procedure code with multiple summary functions and requires a trace log. Which configuration is correct?
Options:
Use Clarity as the data source, group via the Display tab, and enable trace logging.
Build in Chronicles, configure summary targets, and disable ad hoc searches.
Create in SlicerDicer, add procedure code slices, and enable security points.
Use Caboodle, assign Action Groups, and configure Threshold Overrides.
Answer:
AExplanation:
A Cogito SQL report that is sourced from Clarity, grouped by a field and calculated with several metrics follows a consistent configuration. The correct setup is: use Clarity as the data source, group via the Display tab, and enable trace logging. Clarity supplies the relational data, the Display tab defines the grouping and summary functions, trace logging records the execution for review, and a report group limits who may run it. Other choices fail for stated reasons: Chronicles is the source for Workbench reports and not for SQL, a SlicerDicer session does not support custom report logic, and Caboodle with threshold overrides mixes tools that do not belong together. The developer should test the report with realistic volumes, because grouping can be expensive, and should review the trace after early runs to verify that the grouping and functions behave as expected. Compare the totals with an independent count before release. The analyst should also tell the requester what was changed and when the correction takes effect, since users often assume that a repair is immediate when some changes appear only after the next load or a new sign-in.
A hospital needs to benchmark its surgical case cancellation rates against Epic community data in a Radar dashboard, with drill-down to case details and dynamic thresholds based on surgical specialty. Which configuration achieves this complex requirement?
Options:
Use Dashboard Metrics with Epic ' s benchmarking database, configure a Hyperspace activity link, and enable Specialty-Based Dynamic Thresholds in the Component Editor.
Create a SlicerDicer session with a benchmarking filter, enable drill-down, and add specialty-based slices for thresholds.
Build a Reporting Workbench report with community benchmarking, link to the dashboard, and configure specialty-based summary targets.
Configure the Analytics Catalog to query Epic ' s Clarity database with drill-down and specialty filters.
Answer:
AExplanation:
To place an organization ' s results beside those of its peers, the dashboard must use metrics that have a community counterpart. The scenario is resolved by this: use Dashboard Metrics with Epic ' s benchmarking database, configure a Hyperspace activity link, and enable Specialty-Based Dynamic Thresholds in the Component Editor. The benchmarking database supplies the community values, and the component presents them alongside the local result. SlicerDicer filters, Workbench report settings and catalog links do not create such a comparison. The developer should verify that the metric is mapped to the community identifier, that data sharing is active and that the additional features requested, such as drill-down, dynamic thresholds or export, are enabled in the component. It is also prudent to explain the comparison group on the dashboard, because users may otherwise assume that the benchmark covers all organizations when it covers only those that report the measure. Reviewing the work against the guiding principles for analytics content, namely that the content works, that each part works, that the audience is defined and that the audience has the security it needs, is a reliable final check.
You want to explore patients with overdue colonoscopies grouped by age. What ' s the best approach?
Options:
Filter by " colonoscopy status " , slice by " age group "
Use link component
Apply threshold coloring to table view
Launch a Radar dashboard
Answer:
AExplanation:
To explore patients with overdue colonoscopies grouped by age, the user defines the population with a criterion and divides it with a slice. The criterion, expressed here as the colonoscopy status of overdue, includes only the patients who match. The slice by age group then divides that population into subgroups, such as ten-year bands, so that the distribution of overdue patients across ages is visible. This approach is the first option. A link component provides a shortcut on a dashboard and does not analyze data. Threshold coloring in a table view highlights values that meet a condition but does not group the population by age, and it would be a display refinement and not an analysis step. Launching a Radar dashboard would display existing content and would not create a new analysis, although a saved session could later be placed on a dashboard. The method follows the usual sequence: select an appropriate data model, narrow the population with criteria, group with slices, and confirm the measure and visualization. The result can then be saved and shared with the team that manages outreach for overdue screenings.
What tool is used to research Clarity tables and columns?
Select one of the following (1 PT)
Options:
Data Dictionary
Item Editor
Category List Maintenance
Report Repository
Answer:
AExplanation:
The Data Dictionary is the reference tool for Clarity structure. For each table it presents an overview and description, load frequency, primary key, columns with data types, category lookup tables, dependencies and, critically, the Chronicles Info that identifies the INI and item feeding each column. Analysts use it in both directions: starting from a table or column name to understand its purpose, or starting from a Chronicles item to find where Clarity stores it. It also reports whether a column has been deprecated. The other tools address different layers of the architecture. The Item Editor describes Chronicles item definitions, including add type and response type, and says nothing about Clarity tables. Category List Maintenance manages the values of category lists in Chronicles. The Report Repository catalogs Epic-delivered reports and analytics content, which can indicate which tables a delivered report uses, but it is not a means of researching table and column definitions. A sound research sequence is to identify the item in Chronicles, search the Data Dictionary for its table and column, review the description and primary key, and then construct the query. Mastery of this sequence underpins most of the data architecture content in the certification.
You need to report on all hospitalizations and display the patient class at the time of discharge. You learn that this category value and the full category list are stored in I EPT 10110.
Part 2 of 2
You identify the appropriate table and column as PAT_ENC_HSP.ADT_PAT_CLASS_C. To identify the appropriate ZC_table to display the patient ' s class in your query, which of the following steps should you take?
Select one of the following (1 PT)
Options:
Look up I EPT 10110 in the Record Viewer
Look up I EPT 10110 in the Item Editor
Open PAT_ENC_HSP in the Data Dictionary
Use Clarity naming conventions
Answer:
CExplanation:
Category values are stored in Clarity as numeric codes in columns ending in _C, such as ADT_PAT_CLASS_C. The readable names live in separate ZC_ tables, which Clarity builds from the Chronicles category list. To display the patient class, the query must join the _C column to the appropriate ZC_ table and return its NAME column. The Data Dictionary entry for the owning table lists every column together with its Category Lookup, which names the ZC_ table for each category column. Opening PAT_ENC_HSP and reading the Category Lookup for ADT_PAT_CLASS_C therefore gives the exact table to join. The Record Viewer and the Item Editor are Chronicles tools and cannot state which Clarity table was generated from a category list. Relying on naming conventions is unreliable: ZC_ table names are not guaranteed to mirror the column name, and a guessed name could select a different list or fail altogether. Verified lookup is the professional standard. The completed pattern is to join the encounter table to the ZC_ table on the category number and select the name, producing a report that displays the patient class, such as inpatient or observation, rather than a bare number.
A dashboard component must display real-time patient discharge data with a link to the Discharge Planning activity and dynamic thresholds based on discharge destination. Which data source and configuration ensure this complex functionality?
Options:
Chronicles; configure real-time extraction, a Hyperspace activity link, and Destination-Based Dynamic Thresholds in the Component Editor.
Caboodle; schedule frequent ETL processes, enable summary targets, and add destination-based filters.
Clarity; set aggregated data, link to a SlicerDicer session, and configure threshold overrides.
SlicerDicer; add a real-time discharge filter, configure Action Groups, and enable dynamic thresholds.
Answer:
AExplanation:
A requirement for live information, such as triage, transfers, bed occupancy or the surgical schedule, directs the design toward the operational database. The scenario is resolved by this: chronicles; configure real-time extraction, a Hyperspace activity link, and Destination-Based Dynamic Thresholds in the Component Editor. Real-time extraction supplies current values, the activity link supports immediate action and the threshold rules, if specified, highlight the items that need attention. Alternatives based on scheduled loads, aggregated data or SlicerDicer cannot meet the real-time requirement. The developer should consider performance, because operational queries compete with clinical use, and should design the component with efficient criteria. Users should be told how frequently the display refreshes, since a figure that updates every few minutes is different from one that updates continuously, and they should confirm that they have the security to open the linked activity. It is good practice to record the cause and the correction in the component or report description, so that colleagues who meet the same symptom later can resolve it quickly without repeating the investigation.
If a user can ' t view a particular SlicerDicer data model, what ' s likely the issue?
Options:
Incorrect default chart type
Visualization settings are not saved
They lack the necessary security class or permissions
Filters are applied incorrectly
Answer:
CExplanation:
The data models that appear in SlicerDicer are controlled by security. A user sees a model only if their security classes or related permissions grant access to it, which protects sensitive subject areas, such as financial or behavioral health data, from users who do not need them. When a model that colleagues can open is missing for a particular user, the most probable cause is therefore a missing security class or permission, which is the third option. An incorrect default chart type affects only how results are displayed once a model has been opened, and it cannot hide a model. Visualization settings that are not saved cause the user to lose preferences between sessions but do not remove data models from the list. Incorrectly applied filters change which records are counted within a session and likewise have no effect on which models are offered. The appropriate resolution is for the analyst to compare the user ' s security with that of a user who can see the model, and to request that the relevant class be added through the organization ' s security process. Testing with a proxy view of the user can confirm the diagnosis.
A user attempts to personalize a source dashboard by adding a custom SlicerDicer component, but the personalization record does not save changes to slices. What advanced personalization setting in the Dashboard Editor restricts this?
Options:
The source dashboard has " Lock personalization " enabled on the Access form
The SlicerDicer session is not enabled for personalization
User lacks the security class for edits
Component is set as source only, not personal
Answer:
A, CExplanation:
When a user cannot save changes to the slices of a SlicerDicer component that was added to a personalized dashboard, two settings may restrict the personalization. The source dashboard may have personalization locked on its Access form, which prevents users from changing the content that the administrator has defined. The user may also lack the security class that permits edits. These are the first and third options. The SlicerDicer session not being enabled for personalization is not a recognized restriction. A component marked as source only is not a setting that explains why changes to slices would not be stored. The developer should check the dashboard ' s Access form first, since the lock is a deliberate configuration that is easy to verify, and then compare the user ' s security classes with those of a colleague who is able to personalize. If the restriction is intentional, the user should be told that changes can be made only in the source record by the owner, or in a personal copy of the content where one is allowed.
Which master file stores dashboard resources used to display metric data?
Options:
IDN
IDK
IDJ
CSF
Answer:
BExplanation:
Dashboard resources, which determine how metric data is displayed and how a user can drill into it, are stored in the IDK master file. A resource record holds display and drill-down behavior for metric-based tiles, linking the presentation on a dashboard to the metric framework. The correct answer is therefore IDK. IDN is the master file that holds summary level definitions, which describe the levels at which a metric can be summarized, such as department or provider, and it does not store dashboard resources. IDJ is associated with metrics that are defined and run through manual SQL. CSF holds the data values for metrics as they appear on a dashboard. Distinguishing these master files is helpful when troubleshooting. If a tile displays the wrong drill-down, the dashboard resource is reviewed, whereas if the choices of summary level are incorrect, the summary level definitions are the place to look. Recognizing which structure stores which part of the framework allows the analyst to navigate directly to the relevant record.
A dashboard component fails to display data due to a data source mismatch. The component uses a SlicerDicer session. What should be corrected?
Options:
Align the component ' s data source with the SlicerDicer session ' s database.
Update the component ' s security settings in Hyperspace.
Rebuild the dashboard ' s Access form for user permissions.
Modify the SlicerDicer session ' s filter settings.
Answer:
AExplanation:
A component that displays incorrect values or fails to load, and that is built on a SlicerDicer session, must refer to the same data source as the session. The correct action is: align the component ' s data source with the SlicerDicer session ' s database. If the component reads from a different database or connection, it will present figures that disagree with the session or no figures at all, and the discrepancy cannot be solved by changes to security or filters. The developer should open the component record, compare its data source with the database used by the session and make them match, then compare the component with the session itself using identical criteria and dates. Rebuilding the session in another tool, changing the report group or checking permissions does not repair a mismatched source. Documenting the relationship between the component and its session helps others to maintain it later. Where several settings could plausibly be responsible, changing one at a time and retesting after each change makes it possible to learn which setting actually solved the problem, which is useful knowledge for later maintenance.
A dashboard component ' s Hyperspace activity link works for admins but not for standard users. What is the likely cause?
Options:
Standard users lack security points for the activity.
The component ' s data source is set to Clarity.
The dashboard ' s Layout form restricts user interaction.
The activity descriptor is not enabled in Chronicles.
Answer:
AExplanation:
When a Hyperspace link behaves differently for different users, the difference almost always comes from security. The solution to this scenario is: standard users lack security points for the activity. The component ' s own configuration is valid, as shown by the fact that it works for some people. What differs is the user, and the activity opened by the link is protected by points that must be present in the user ' s class. Options that propose a different data source, a layout restriction or an unregistered descriptor would affect everyone equally. The recommended steps are to compare a working user with a failing one, to identify the missing points and to arrange the change through the security administrator. The organization should also confirm that granting the points is appropriate, because the activity may expose sensitive information that the user does not need for their role. The analyst should also tell the requester what was changed and when the correction takes effect, since users often assume that a repair is immediate when some changes appear only after the next load or a new sign-in.
Before creating a new display column in a report, what should you always do first?
Options:
Check for existing columns using INI and item number
Ask the IT helpdesk
Clone a SQL script from Clarity
Save the report with default parameters
Answer:
AExplanation:
Before creating a new display column, the analyst should always check for existing columns using the INI and item number. Display columns are reusable, and an organization that has been building reports for some time is likely to have a column that retrieves the data point already. Searching by the master file and item gives a precise result, because two columns with different names may still read the same item. The first option is correct. Asking the IT helpdesk does not help, since the helpdesk does not manage column definitions. Cloning a SQL script from Clarity is unrelated, as Workbench columns do not use SQL scripts. Saving the report with default parameters has no connection with the question. Reusing columns keeps the system tidy and makes maintenance easier, since a change to a single column applies wherever it is used. It also reduces the risk of inconsistency, in which two reports show the same data point with different logic. Only when no suitable column exists should a new one be created, with a clear name and description.
What does the Starting Summary Level control?
Options:
The data source for Reporting Workbench
The default level of summarization when a dashboard opens
The refresh time of Radar tiles
The export format for Clarity
Answer:
BExplanation:
The Starting Summary Level controls the default level of summarization at which a dashboard opens. When a user first opens a metric-based dashboard, the data is shown at this level, for example the organization as a whole or a department, and the user can then move to other levels that have been made selectable. The second option is correct. The data source for Reporting Workbench is set in report templates and is unrelated. The refresh time of Radar tiles is governed by how often the underlying metric values are calculated and stored. The export format for Clarity is not a dashboard setting. A well-chosen starting level helps users orient themselves, since a manager may prefer to begin with a summary of the whole service line and drill down, while a department head may want to begin with the department. It is distinct from the selectable summary levels, which define the levels that the user may choose to view. The developer sets the starting level in the Resource Settings of the Dashboard Editor.
What is the purpose of the IDJ master file?
Options:
To store summaries of broadcast messages
To define and run manual SQL-based metrics
To display user security activity
To build notification parameters
Answer:
BExplanation:
The IDJ master file is used to define and run manual SQL-based metrics. When a metric cannot be expressed through the standard metric framework, it can be defined with a SQL query, and the IDJ record holds that definition and supports running it so that the values can be stored and displayed on dashboards. The second option is correct. Summaries of broadcast messages are unrelated, since broadcast messages are a messaging feature. Displaying user security activity is an audit function. Building notification parameters is the role of the Notification Editor and its records. The master file allows analysts to bring data that is available in Clarity into the metric framework, so that it can appear beside standard metrics and use the same dashboard features, such as summary levels and drill-down behavior. Metrics of this kind require a developer who is familiar with SQL, and they should be tested carefully, since their performance and accuracy depend on the query that has been written and on the Clarity data that it uses.
A Radar dashboard, enabled and Ready for Use, is not visible to a specific user group. The dashboard includes SlicerDicer-based components. What should the administrator check first?
Options:
The dashboard ' s Access form for inclusion of the user group ' s Report Groups.
The components ' Display Titles in the Component Editor.
The SlicerDicer sessions ' data extraction to Caboodle.
The dashboard ' s Owning Application for Cogito settings.
Answer:
AExplanation:
Where one group of users reports that a released dashboard is not visible, the connection between the group and the dashboard is where the cause lies. The correct action is: the dashboard ' s Access form for inclusion of the user group ' s Report Groups. Visibility is determined on the Access form through report groups and user types, and any group that is missing from it will not see the dashboard. The other options, which concern titles, data sources or ownership, do not decide who may view the content. The recommended sequence is to review the form, add the appropriate group and test the dashboard with an account from that group. The developer should also review the dashboard ' s components, because a user who can open the dashboard but not its components will have a poor experience, and every user in the audience must have the security to use all of them. Where several settings could plausibly be responsible, changing one at a time and retesting after each change makes it possible to learn which setting actually solved the problem, which is useful knowledge for later maintenance.
A SlicerDicer session in a dashboard component shows incomplete data for patient admissions. The session uses the Admissions data model. What could resolve this issue?
Options:
Schedule regular ETL processes to update Caboodle.
Switch the data source to real-time Chronicles data.
Rebuild the session with new filters in Hyperspace.
Assign a new Report Group to the component.
Answer:
AExplanation:
Stale results in a component that rests on Caboodle point to the warehouse load and not to the dashboard configuration. The approach that addresses the scenario is: schedule regular ETL processes to update Caboodle. Caboodle is refreshed by scheduled ETL jobs, and a longer interval between jobs means a longer period during which recent activity is not represented. Alternatives such as new filters, a new report group or a rebuilt session leave the schedule untouched, and Chronicles cannot be used as the live source for a SlicerDicer session. The developer should begin by confirming the time of the last successful load and by examining any errors, then decide with stakeholders what freshness is genuinely necessary. Greater frequency has a cost, so it should be justified by a business need. After the change, a comparison of the component with a recent operational list confirms that the data is now arriving as expected and that the improvement is lasting.
What does the Dashboard Editor have?
Options:
Has up to six forms that control the dashboard ' s content and its metadata.
One form
No forms
Infinite forms
Answer:
AExplanation:
The Dashboard Editor has up to six forms that control the content of the dashboard and its metadata. Among them are the Basic Information form, which records the purpose and ownership, the Layout form, which sets the regions and views, the Content form, which places components, and the Access form, which governs who may use the dashboard and what type it is. Additional forms address other aspects such as parameters and display. This structure lets the developer address each concern separately and in a logical order. The first option is correct. The editor is not limited to one form, it clearly has forms, and the number is not unlimited. A developer who knows the purpose of each form can work efficiently and diagnose problems more quickly, for example by going straight to the Access form when users cannot see a dashboard, or to the Layout form when components are arranged incorrectly. It is useful to review every form before releasing a dashboard, since a setting on one form can affect how another behaves.
When sharing a SlicerDicer session, what does the recipient receive?
Options:
A printout of filters
A static PDF
A live, interactive version of your session
A link to reset their dashboard settings
Answer:
CExplanation:
When a SlicerDicer session is shared, the recipient receives a live, interactive version of the session. The recipient can open it, examine the population and adjust views such as slices and visualizations for their own exploration, though the original is preserved because the shared version is read-only. This allows the sender and the recipient to work from the same analysis without having to recreate the criteria. The third option expresses this. A printout of the filters would convey the configuration but not provide a working session. A static PDF is a different type of export that cannot be explored. A link used to reset dashboard settings is unrelated and describes a personalization function in Radar. It is worth recalling that the data the recipient sees is subject to their own security, so two users opening the same shared session may see different results if their access differs. For that reason, a person sharing a session with a colleague in another department should confirm that the recipient has equivalent access to the data model and the base that the session uses.
A dashboard component ' s Hyperspace activity link fails for non-admin users despite a valid activity descriptor. What is the cause?
Options:
Non-admin users lack security points for the Hyperspace activity.
The component ' s data source is set to Clarity.
The dashboard ' s Layout form restricts interaction.
The activity descriptor is not enabled in Chronicles.
Answer:
AExplanation:
A link to a Hyperspace activity works only for people who are permitted to open that activity. When administrators succeed and other users fail despite a valid descriptor, the difference is security. The correct explanation is: non-admin users lack security points for the Hyperspace activity. The descriptor tells Radar which activity to launch, but it does not grant the right to use it, so each user ' s security class must include the necessary points. The other options look at the data source, the layout or the registration of the descriptor, none of which would produce a failure that affects only some users. The developer should compare the security class of a user who can open the link with that of one who cannot, identify the missing points and ask the security administrator to add them if the audience is meant to have the access. If the activity should not be available to everyone, the dashboard ' s audience should be narrowed instead. This follows the principle that every user of a dashboard must be able to use every component on it.
You ' ve been asked to find all patients assigned to providers in your clinic who smoke. You also want to see how many belong to each PCP. What do you do?
Options:
Criterion = smokers + Slice by PCP
Filter = provider + Measure = smoker rate
Chart = Line + Filter = Smoking history
Use Chart Review
Answer:
AExplanation:
Finding smokers among the patients assigned to providers in a clinic, and counting how many belong to each primary care provider, calls for a criterion and a slice. The criterion for smoking status selects the patients who smoke, defining the population. The slice by primary care provider then divides that population so that the number for each provider is displayed. This is the first option. A filter on provider combined with a smoker rate measure would calculate a single percentage and would not show how the patients are distributed among providers. A line chart with a filter on smoking history is not appropriate, because a line chart shows change over time and the question concerns distribution. Chart Review is a clinical activity for examining an individual patient ' s chart and offers no population analysis. The base or a criterion can also restrict the population to the clinic ' s providers, so that only patients assigned to them are counted. A bar graph is the most effective way to present the final result, since it permits direct comparison of the provider counts.
A dashboard component fails to load due to a data source mismatch. The component uses a SlicerDicer session. What should be corrected?
Options:
Align the component ' s data source with the SlicerDicer session ' s database.
Update the component ' s security settings in Hyperspace.
Rebuild the dashboard ' s Access form for user permissions.
Modify the SlicerDicer session ' s filter settings.
Answer:
AExplanation:
A component that depends on a SlicerDicer session needs a data source that agrees with that session, and the scenario describes a failure of that agreement. The correct step is: align the component ' s data source with the SlicerDicer session ' s database. Mismatched sources lead to errors or discrepancies that no amount of changing permissions or filters can solve. The developer should compare the settings, correct the data source and view the component again. Testing should include a check of the values against the session using the same population, and the dashboard should be reviewed with an affected user. Recording the connection between the component and the session in the component ' s description reduces the time needed to resolve similar issues in future. It is good practice to record the cause and the correction in the component or report description, so that colleagues who meet the same symptom later can resolve it quickly without repeating the investigation.
An analyst creates a Reporting Workbench report to track medication errors by department, with data grouped by error type. The report must be accessible only to quality assurance staff and include a trace log. Which configuration achieves this?
Options:
Assign a shared Report Group, enable trace logging in Report Settings, and use Chronicles as the data source.
Build the report in Clarity, restrict access via Action Groups, and enable ad hoc searches.
Use a SlicerDicer session, set security points for quality assurance, and disable trace logging.
Configure the report in Caboodle, assign user roles in Hyperspace, and set summary targets.
Answer:
AExplanation:
A Workbench report that tracks medication errors by department, groups the results by error type, is accessible only to quality assurance staff and includes a trace log is configured with three elements. A shared report group is assigned so that only the members of that group can find and run it. Trace logging is enabled in the report settings, which records the activity of the report and allows the organization to review who ran it and when, an important control for sensitive quality data. Chronicles is used as the data source, which is the source for Workbench reports. The first option is correct. Building the report in Clarity or Caboodle, or in a SlicerDicer session, would move it to different tools, and disabling trace logging would contradict the requirement. Action groups do not provide the access control described, and summary targets are unrelated. After configuration, the developer should confirm that a user outside the group cannot see the report, and that a member of the group can run it and that the activity appears in the trace.
True or False: A private report can be run by anyone but only edited by the creator.
Options:
False
True
Answer:
AExplanation:
The statement is false. A private report is visible by default only to the person who created it, so it cannot be run by anyone. Other users do not see it in their Library, and they have no means of running or editing it unless the creator changes it to public or shares it. The distinction between private and public reports therefore concerns visibility first, and editing rights follow from it. A public report can be seen and run by users with access to the template, while the ability to edit it is controlled separately, for example by security classes that allow the editing of public reports. The statement that a private report can be run by anyone confuses the two kinds of report. Creators should use private reports for work in progress or personal needs and convert reports to public once they are ready to be shared. Administrators who must review a private report to assist its owner can do so through support features, such as viewing another user ' s Library with appropriate authority, which is a deliberate exception and not the ordinary behavior.
What is a Security Class?
Options:
A group of templates that define report filters
A record that defines which actions a user can perform
A setting for record retention policies
A field that limits MyChart access
Answer:
BExplanation:
A security class is a record that defines which actions a user can perform. Examples include editing public reports, exporting line-level details, using Proxy Mode or accessing particular activities. Administrators assign classes to users or roles, and the application checks them whenever the user attempts the action. This is the second option. A group of templates that define report filters describes something different, since templates are managed through report types and report groups. A setting for record retention policies is a data governance matter. A field that limits MyChart access relates to the patient portal. The class itself does not determine what content a user sees, because visibility is governed by report groups, and so the difference between permission to act and permission to view is important. A user who can see a report but cannot edit it needs a class that permits editing, and a user who cannot see it at all needs to share a report group with it. Recognizing which mechanism applies shortens the time needed to resolve access requests.
A Radar dashboard component is not visible in the Analytics Catalog despite being enabled and part of an enabled dashboard. The dashboard is marked Ready for Use. What is the likely cause?
Options:
The component lacks a Display Title in the Display form.
The dashboard ' s Owning Application is set to Clarity.
The component ' s data source is not Caboodle.
The user lacks Analytics Catalog access permissions.
Answer:
AExplanation:
A component that is enabled and belongs to an enabled dashboard marked Ready for Use may still be missing from the Analytics Catalog if it has no display title in the Display form. The catalog presents content to users by its display title, so a component without one cannot be shown meaningfully, and users have nothing to browse or search for. The first option is correct. The owning application does not decide whether the component appears, and the data source being Caboodle is not a requirement for listing. A user without catalog permission would be unable to see any content, so the problem would be broader than one component. The developer should open the component, complete the display title and the description, and then check the catalog again. Because these fields are what users read, they should be informative, naming the subject of the component and the audience. After the change, a search by relevant terms should locate the component, which confirms that the content is discoverable.
Jason clicks on a column to sort his results. What happens when he clicks it again?
Options:
The sort is removed
The sort is reversed
The column is deleted
The data is filtered
Answer:
BExplanation:
When a user clicks a column to sort the results, the data is ordered by that column, and clicking the same column again reverses the sort. The first click typically orders the values from lowest to highest, and the second click orders them from highest to lowest. The second option is correct. The sort is not removed by a second click, so the first option is incorrect. The column is not deleted, and the data is not filtered, because sorting changes only the order of the rows and not which rows are displayed. Sorting is a convenient way to find the largest or smallest values or to group similar items together, for example by date or provider. It works on the results already returned, so it does not require the report to be run again. Where the user wants to limit the rows, the Filters tab should be used, and where the user wants a different set of records, the criteria must be changed. Understanding these differences helps users work efficiently in the Results Viewer.
How frequently is SlicerDicer data refreshed?
Options:
Live with every record change
Every time Hyperspace launches
Nightly or based on Caboodle extract schedule
Manually by users only
Answer:
CExplanation:
SlicerDicer data is not live. The tool reads from Caboodle, which is loaded from Clarity by scheduled ETL processes, and Clarity itself is loaded from Chronicles by the nightly extract. The data shown therefore reflects the most recent completed load, typically as of the previous night, and the exact schedule is determined by the organization ' s Caboodle extract configuration. This is the meaning of the third option. Live updates with each record change would require querying Chronicles directly, which SlicerDicer does not do, so the first option is false. Refreshing every time Hyperspace launches is not the design, and launching the application does not trigger an extract. Manual refresh by users only is also inaccurate, since the data is refreshed by the system according to schedule and users cannot rebuild the warehouse. The consequence for users is that activity entered today will normally not appear in results until the next load completes. For same-day operational needs, tools that read Chronicles directly, such as Reporting Workbench, should be used instead, and administrators monitor warehouse loads in the Caboodle Console.
A dashboard component fails to open a linked Hyperspace activity for certain users, despite a correct activity descriptor and Dashboard Resources as the data source. The dashboard is accessible. What is the cause?
Options:
The users lack security points for the Hyperspace activity in their security class.
The component ' s data source is not aligned with the SlicerDicer session.
The dashboard ' s Layout form restricts non-admin interactivity.
The activity descriptor is not enabled in the Chronicles master file.
Answer:
AExplanation:
The pattern here, success for some users and failure for others, directs attention to permissions. The correct diagnosis and remedy is: the users lack security points for the Hyperspace activity in their security class. The component has the right descriptor and data source, so it is configured correctly, but the destination activity has its own security requirement, and the dashboard cannot override it. Changing the data source, relaxing the layout or re-registering the descriptor would not help users who lack authorization. The developer should confirm the missing points by comparing security classes, discuss the request with the owner of the activity and, once approved, have the administrator update the class. Afterward the link should be tested again with an affected user. Because the failure message is often unhelpful, a short note beside the component that names the role needed can save users and the analytics team from avoidable confusion. It is good practice to record the cause and the correction in the component or report description, so that colleagues who meet the same symptom later can resolve it quickly without repeating the investigation.
Who creates Radar dashboards and builds Reporting Workbench templates?
Options:
Clarity Administrator
Cogito Business Intelligence Developer
Chronicles Administrator
Application Analyst
Answer:
BExplanation:
The Cogito business intelligence developer creates Radar dashboards and builds Reporting Workbench templates. These developers design the analytics content that users see, including dashboards composed of components and the templates from which reports are created, and they work with the data sources provided by the other Cogito roles. The second option is correct. The Clarity administrator maintains the relational reporting database and its extract and does not design dashboards. The Chronicles administrator supports the operational database. An application analyst configures a specific Epic application and may request analytics content, but building dashboards and templates is a specialized skill of the business intelligence developer. This division allows each role to concentrate on its area of expertise. When a department asks for a new dashboard, the request is typically defined by a Cogito business analyst, then built by the business intelligence developer, and the training team ensures that users know how to use it. Knowing who builds what helps analysts to send requests to the correct role and to anticipate the dependencies involved.
What does " Proxy Mode " allow a user to do?
Options:
Run reports on another user ' s behalf without login
View dashboards and reports as another user to troubleshoot access
Grant full administrative access to restricted data
Automatically submit batch jobs to Clarity
Answer:
BExplanation:
Proxy Mode allows a user with the appropriate authority to view dashboards and reports as another user, so that access problems can be investigated. The analyst sees the structure that the other user sees, such as the Library layout and which dashboards are available, which makes it possible to determine why content is missing or why a layout differs. This is the second option. Running reports on another user ' s behalf without login describes impersonation, which Proxy Mode does not allow, since actions that would produce data are restricted. Granting full administrative access to restricted data is the opposite of its purpose, which is limited and controlled. Automatically submitting batch jobs to Clarity is unrelated. The mode is valuable for support because many problems with analytics content come from differences in security, report groups or user types, and being able to see the user ' s view quickly narrows the cause. Because it deals with another user ' s access, the feature is protected by security and its use should be limited to staff who need it for troubleshooting.
You have built a component. You then edit a source dashboard in the Designer UI and click Add Component but can ' t find your component. Why not?
Options:
You are trying to add the component to a view.
You haven ' t refreshed the dashboard! Press ALT + = to refresh.
The component is not distributed to you.
Your component isn ' t enabled.
Answer:
DExplanation:
When a source dashboard is opened in the Designer UI and Add Component is selected, the list that appears is not every component record in the system. It is limited to components that have been configured as available for selection, and a component record that is not enabled is simply omitted. That is the most probable explanation for a newly built component that cannot be found. A component also has a ready-for-use setting, which governs whether the record can be used at all, so both flags should be reviewed after building. The other options do not hold up. Adding a component to a view rather than a source dashboard changes the context but does not make a component vanish, and the stem states that the source dashboard is being edited. Refreshing the dashboard with a keyboard shortcut redraws the display and does not alter which records the picker offers. Distribution to the user concerns report groups and security rather than whether the record is enabled, and it would affect users generally, not the builder of the component. Checking the Basic Information and Access settings of the component is the right remedy.
A Radar dashboard component, linked to a SlicerDicer session using the Patients data model, displays outdated vaccination compliance data from Caboodle. The dashboard is enabled, and some users report inconsistent threshold indicators. How should the analyst address these issues?
Options:
Increase ETL frequency to update Caboodle, verify the session ' s data source, and enable User-Specific Threshold Overrides in the Component Editor.
Switch the session to Chronicles for real-time data and rebuild the session with new filters.
Assign a new Report Group to align the session and update security points for thresholds.
Rebuild the session in Clarity and configure summary targets for thresholds.
Answer:
AExplanation:
When the numbers shown in a SlicerDicer-driven component lag behind reality, the explanation lies in the movement of data and not in the component. The correct resolution is: increase ETL frequency to update Caboodle, verify the session ' s data source, and enable User-Specific Threshold Overrides in the Component Editor. Each extract moves data from one database to the next, and the component can show only what has completed that journey. The other options attempt to fix the problem in the wrong place: rebuilding the session or changing its filters does not change what Caboodle holds, a new report group alters access, and Chronicles is not a source for this tool. The analyst should compare the latest record in the warehouse with the latest in the source, which shows how large the gap is, and then work with the administrator on the schedule. Where a business requirement demands data that is fresher than a warehouse can reasonably supply, an operational Workbench report is the better choice, and it should be offered as a complement to the dashboard.
A Cogito SQL report, sourced from Clarity, must group outpatient visits by provider specialty and calculate average visit duration, with a trace log for troubleshooting. The report is restricted to clinic managers. Which configuration is correct?
Options:
Use Clarity, group via the Display tab, enable trace logging, and assign a Report Group for clinic managers.
Build in Chronicles, configure summary targets, disable trace logging, and set security points.
Create in SlicerDicer, add specialty slices, enable ad hoc searches, and restrict via Action Groups.
Use Caboodle, assign user roles in Hyperspace, and configure Dynamic Thresholds.
Answer:
AExplanation:
Reports that require grouping, calculated metrics, logging and restricted access are assembled from specific components. The correct configuration is: use Clarity, group via the Display tab, enable trace logging, and assign a Report Group for clinic managers. The relational structure of Clarity supports the SQL aggregation, the Display tab holds the grouping, trace logging records how the report is used and report group assignment protects the content. The other options select the wrong platform or tool, or they omit a requirement, for example by disabling the log. The developer should test the report with a representative population and check performance, then confirm the trace entries appear after a run. Any additional requirement named in the answer, such as export or a dynamic filter, should be tested by a user in the intended role, since a feature that works for the developer may be unavailable under the user ' s security. Before release, the developer should retest the change with an account that has the same security as the intended audience, because a result that looks correct for a developer can still fail for a typical user.
A Reporting Workbench report must calculate average length of stay by department using Clarity data. How should this be configured?
Options:
Use a Cogito SQL template with an aggregate function in Clarity.
Create a SlicerDicer session with length of stay filters.
Configure a summary target in Chronicles.
Assign a new Action Group for data access.
Answer:
AExplanation:
When a report needs a value that is derived from Clarity, such as a rate, an average or a score, the derivation is written in a Cogito SQL template. The scenario is resolved by this: use a Cogito SQL template with an aggregate function in Clarity. SQL provides the aggregation and calculation capabilities that the Workbench template alone does not, and Clarity holds the historical data on which they run. Alternatives that rely on sessions, summary targets or action groups do not perform the required computation. The developer should validate the query against a known example, check that the grouping is at the intended level and consider the runtime, since large aggregations can be heavy. The report should be scheduled outside periods of high load where necessary, and the definition of the measure should be recorded so that the stakeholders who read it understand exactly what has been calculated. The analyst should also tell the requester what was changed and when the correction takes effect, since users often assume that a repair is immediate when some changes appear only after the next load or a new sign-in.
A dashboard component must display real-time surgical schedule data with a link to the Surgical Case activity. Which data source and configuration ensure this functionality?
Options:
Chronicles; configure real-time extraction and a Hyperspace activity link.
Caboodle; schedule frequent ETL processes and enable summary targets.
Clarity; set aggregated data and link to a SlicerDicer session.
SlicerDicer; add a real-time schedule filter and configure Action Groups.
Answer:
AExplanation:
Where timeliness is the main requirement, the choice of source is decisive. The correct configuration is: chronicles; configure real-time extraction and a Hyperspace activity link. Chronicles holds the transactional data, so the component can present current counts and lists, and the activity link lets staff act on them. The warehouse and the relational reporting database are loaded overnight, which makes them unsuitable for such needs. The developer should test the component under typical load and verify the refresh interval. Dynamic thresholds, if requested, are set in the component so that the indicators adapt to the relevant factors such as level, shift or urgency. As with all linked activities, users need the corresponding security points, and the dashboard should be tested with the people who will use it in practice. The analyst should also tell the requester what was changed and when the correction takes effect, since users often assume that a repair is immediate when some changes appear only after the next load or a new sign-in.
What does Response Type determine for an item?
Options:
Access group
How many lines of data an item can store per instance
Data source type
Export options to Clarity
Answer:
BExplanation:
The response type of an item determines how many lines of data the item can store for each instance, meaning each record or contact. A single response item holds one value. A multiple response item holds a numbered list of values, and a related group item holds lines that correspond to the lines of other items. The second option expresses this. The access group relates to distribution of content and does not depend on the response type. The data source type is a setting in analytics components. Export options to Clarity are not defined by the response type, although the type does influence the structure of the Clarity table that receives the item. When LINE appears in the primary key of a Clarity table, the items extracted to it have a multiple or related response, and queries against it return several rows for each parent record or contact. This should be considered when counting entities, because joining to such a table without accounting for lines can inflate totals. The Item Editor shows the response type.
What system does Epic use for most operational reports?
Options:
Caboodle
Chronicles
Clarity Data Warehouse
SlicerDicer
Answer:
BExplanation:
Epic uses Chronicles for most operational reports. Operational reports must reflect current activity, and Chronicles is the real-time transactional database, so it is the appropriate source. Reporting Workbench searches Chronicles directly and delivers its results within Hyperspace, which makes it the usual tool for these reports. The second option is correct. Caboodle and the Clarity data warehouse are populated by scheduled extracts and reflect data that is typically a day old, so they are suited to analytical reporting. SlicerDicer reads from Caboodle and is therefore also not a source for real-time operational lists. Operational reports are also designed to be small and focused so that they do not burden the operational system, which must remain responsive for clinical users. A report that needs to process large volumes of historical data should be moved to the reporting databases. Analysts should therefore consider the time sensitivity of a request when choosing the source and tool, and should explain the limitations of data latency to stakeholders.
How does the " Use dashboard dates " setting for a SlicerDicer component determine the component ' s behavior on a dashboard?
Options:
If " Use dashboard dates " is not selected, the session will always show data for the date range chose when saving the session. Otherwise the dashboard date range will immediately update the SlicerDicer session whenever it is changed.
Ignores dates always
Fixed dates only
Manual update
Answer:
AExplanation:
The Use dashboard dates setting determines whether the date range of a SlicerDicer component is fixed or follows the dashboard. When the setting is not selected, the session always shows data for the date range that was chosen when the session was saved, regardless of any change to the dashboard ' s dates. When it is selected, the dashboard date range immediately updates the session whenever it is changed, so the component stays aligned with the other components on the page. The first option is correct. The setting does not ignore dates, nor does it restrict the component to fixed dates only, and it does not require a manual update. The choice depends on the purpose of the component. A component that should always show a fixed period, such as the previous year as a reference point, should keep its saved dates, while one intended to reflect the user ' s selection should use the dashboard dates. Developers should document the choice, because users who see a different range in one component may assume that it is an error, and a brief label can prevent confusion.
