Fortinet NSE 7 - Security Operations 7.6 Architect Questions and Answers
When does FortiAnalyzer generate an event?
Options:
When a log matches a filter in a data selector
When a log matches an action in a connector
When a log matches a rule in an event handler
When a log matches a task in a playbook
Answer:
CExplanation:
Understanding Event Generation in FortiAnalyzer:
FortiAnalyzer generates events based on predefined rules and conditions to help in monitoring and responding to security incidents.
Analyzing the Options:
Option A:Data selectors filter logs based on specific criteria but do not generate events on their own.
Option B:Connectors facilitate integrations with other systems but do not generate events based on log matches.
Option C:Event handlers are configured with rules that define the conditions under which events are generated. When a log matches a rule in an event handler, FortiAnalyzer generates an event.
Option D:Tasks in playbooks execute actions based on predefined workflows but do not directly generate events based on log matches.
Conclusion:
FortiAnalyzer generates an event when a log matches a rule in an event handler.
Refer to Exhibit:
A SOC analyst is designing a playbook to filter for a high severity event and attach the event information to an incident.
Which local connector action must the analyst use in this scenario?
Options:
Get Events
Update Incident
Update Asset and Identity
Attach Data to Incident
Answer:
DExplanation:
Understanding the Playbook Requirements:
The SOC analyst needs to design a playbook that filters for high severity events.
The playbook must also attach the event information to an existing incident.
Analyzing the Provided Exhibit:
The exhibit shows the available actions for a local connector within the playbook.
Actions listed include:
Update Asset and Identity
Get Events
Get Endpoint Vulnerabilities
Create Incident
Update Incident
Attach Data to Incident
Run Report
Get EPEU from Incident
Evaluating the Options:
Get Events:This action retrieves events but does not attach them to an incident.
Update Incident:This action updates an existing incident but is not specifically for attaching event data.
Update Asset and Identity:This action updates asset and identity information, not relevant for attaching event data to an incident.
Attach Data to Incident:This action is explicitly designed to attach additional data, such as event information, to an existing incident.
Conclusion:
The correct action to use in the playbook for filtering high severity events and attaching the event information to an incident isAttach Data to Incident.
Refer to the exhibits.
The FortiMail Sender Blocklist playbook is configured to take manual input and add those entries to the FortiMail abc. com domain-level block list. The playbook is configured to use a FortiMail connector and the ADD_SENDER_TO_BLOCKLIST action.
Why is the FortiMail Sender Blocklist playbook execution failing7
Options:
You must use the GET_EMAIL_STATISTICS action first to gather information about email messages.
FortiMail is expecting a fully qualified domain name (FQDN).
The client-side browser does not trust the FortiAnalzyer self-signed certificate.
The connector credentials are incorrect
Answer:
BExplanation:
Understanding the Playbook Configuration:
The playbook "FortiMail Sender Blocklist" is designed to manually input email addresses or IP addresses and add them to the FortiMail block list.
The playbook uses a FortiMail connector with the action ADD_SENDER_TO_BLOCKLIST.
Analyzing the Playbook Execution:
The configuration and actions provided show that the playbook is straightforward, starting with an ON_DEMAND STARTER and proceeding to the ADD_SENDER_TO_BLOCKLIST action.
The action description indicates it is intended to block senders based on email addresses or domains.
Evaluating the Options:
Option A:Using GET_EMAIL_STATISTICS is not required for the task of adding senders to a block list. This action retrieves email statistics and is unrelated to the block list configuration.
Option B:The primary reason for failure could be the requirement for a fully qualified domain name (FQDN). FortiMail typically expects precise information to ensure the correct entries are added to the block list.
Option C:The trust level of the client-side browser with FortiAnalyzer's self-signed certificate does not impact the execution of the playbook on FortiMail.
Option D:Incorrect connector credentials would result in an authentication error, but the problem described is more likely related to the format of the input data.
Conclusion:
The FortiMail Sender Blocklist playbook execution is failing because FortiMail is expecting a fully qualified domain name (FQDN).
Which statement best describes the MITRE ATT&CK framework?
Options:
It provides a high-level description of common adversary activities, but lacks technical details
It covers tactics, techniques, and procedures, but does not provide information about mitigations.
It describes attack vectors targeting network devices and servers, but not user endpoints.
It contains some techniques or subtechniques that fall under more than one tactic.
Answer:
DExplanation:
Understanding the MITRE ATT&CK Framework:
The MITRE ATT&CK framework is a comprehensive matrix of tactics and techniques used by adversaries to achieve their objectives.
It is widely used for understanding adversary behavior, improving defense strategies, and conducting security assessments.
Analyzing the Options:
Option A:The framework provides detailed technical descriptions of adversary activities, including specific techniques and subtechniques.
Option B:The framework includes information about mitigations and detections for each technique and subtechnique, providing comprehensive guidance.
Option C:MITRE ATT&CK covers a wide range of attack vectors, including those targeting user endpoints, network devices, and servers.
Option D:Some techniques or subtechniques do indeed fall under multiple tactics, reflecting the complex nature of adversary activities that can serve different objectives.
Conclusion:
The statement that best describes the MITRE ATT&CK framework is that it contains some techniques or subtechniques that fall under more than one tactic.
Refer to the exhibits.
You configured a spearphishing event handler and the associated rule. However. FortiAnalyzer did not generate an event.
When you check the FortiAnalyzer log viewer, you confirm that FortiSandbox forwarded the appropriate logs, as shown in the raw log exhibit.
What configuration must you change on FortiAnalyzer in order for FortiAnalyzer to generate an event?
Options:
In the Log Type field, change the selection to AntiVirus Log(malware).
Configure a FortiSandbox data selector and add it tothe event handler.
In the Log Filter by Text field, type the value: .5 ub t ype ma Iwa re..
Change trigger condition by selecting. Within a group, the log field Malware Kame (mname> has 2 or more unique values.
Answer:
BExplanation:
Understanding the Event Handler Configuration:
The event handler is set up to detect specific security incidents, such as spearphishing, based on logs forwarded from other Fortinet products like FortiSandbox.
An event handler includes rules that define the conditions under which an event should be triggered.
Analyzing the Current Configuration:
The current event handler is named "Spearphishing handler" with a rule titled "Spearphishing Rule 1".
The log viewer shows that logs are being forwarded by FortiSandbox but no events are generated by FortiAnalyzer.
Key Components of Event Handling:
Log Type: Determines which type of logs will trigger the event handler.
Data Selector: Specifies the criteria that logs must meet to trigger an event.
Automation Stitch: Optional actions that can be triggered when an event occurs.
Notifications: Defines how alerts are communicated when an event is detected.
Issue Identification:
Since FortiSandbox logs are correctly forwarded but no event is generated, the issue likely lies in the data selector configuration or log type matching.
The data selector must be configured to include logs forwarded by FortiSandbox.
Solution:
B. Configure a FortiSandbox data selector and add it to the event handler:
By configuring a data selector specifically for FortiSandbox logs and adding it to the event handler, FortiAnalyzer can accurately identify and trigger events based on the forwarded logs.
Steps to Implement the Solution:
Step 1: Go to the Event Handler settings in FortiAnalyzer.
Step 2: Add a new data selector that includes criteria matching the logs forwarded by FortiSandbox (e.g., log subtype, malware detection details).
Step 3: Link this data selector to the existing spearphishing event handler.
Step 4: Save the configuration and test to ensure events are now being generated.
Conclusion:
The correct configuration of a FortiSandbox data selector within the event handler ensures that FortiAnalyzer can generate events based on relevant logs.
Fortinet Documentation on Event Handlers and Data Selectors FortiAnalyzer Event Handlers
Fortinet Knowledge Base for Configuring Data Selectors FortiAnalyzer Data Selectors
By configuring a FortiSandbox data selector and adding it to the event handler, FortiAnalyzer will be able to accurately generate events based on the appropriate logs.
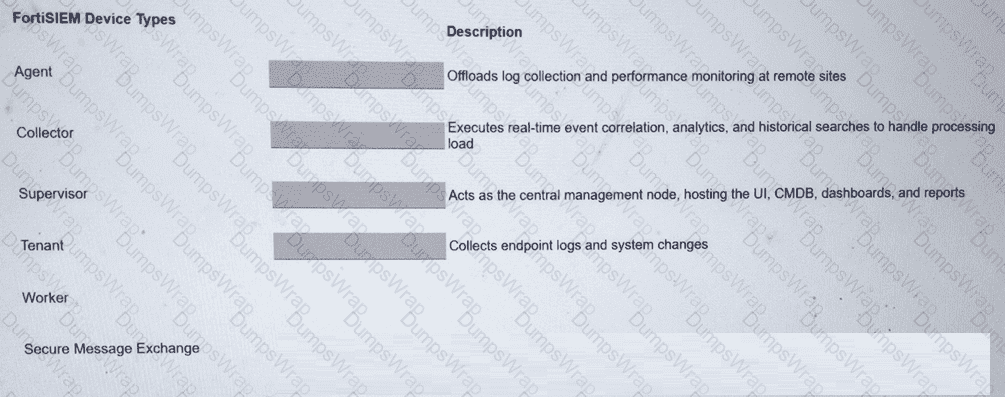
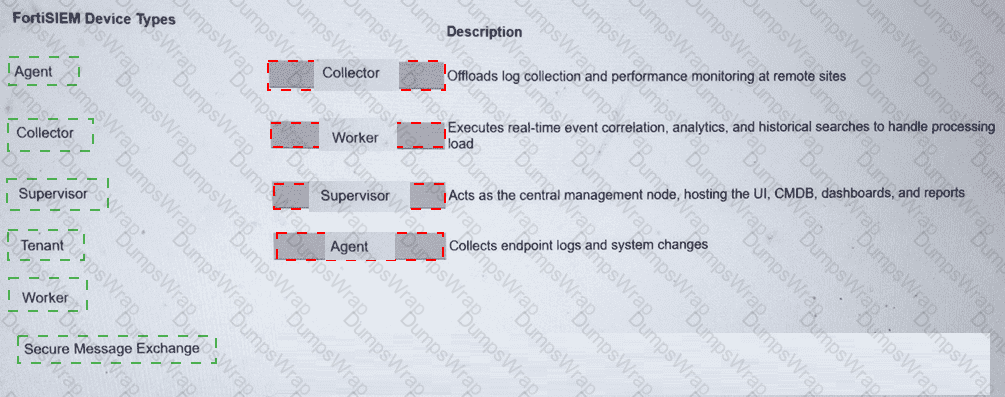
Match the FortiSIEM device type to its description. Select each FortiSIEM device type in the left column, hold and drag it to the blank space next to its corresponding description in the column on the right.
Options:
Answer:
Explanation:
Collector2.Worker3.Supervisor4.Agent
The FortiSIEM 7.3 architecture is built upon a distributed multi-tenant model consisting of several distinct functional roles to ensure scalability and performance:
Supervisor:This is the primary management node in a FortiSIEM cluster. It hosts the Graphical User Interface (GUI), the Configuration Management Database (CMDB), and manages the overall system configurations, reporting, and dashboarding.
Worker:These nodes are responsible for the heavy lifting of data processing. They execute real-time event correlation against the rules engine, perform historical search queries, and handle the analytics workload to ensure the Supervisor node is not overwhelmed.
Collector:Collectors are typically deployed at remote sites or different network segments to offload log collection from the central cluster. They receive logs via Syslog, SNMP, or WMI, compress the data, and securely forward it to the Workers or Supervisor. They also perform performance monitoring of local devices.
Agent:These are lightweight software components installed directly on endpoints (Windows/Linux). Their primary role is to collect local endpoint logs, monitor file integrity (system changes), and track user activity that cannot be captured via traditional network-based logging.
Refer to the exhibits.
The DOS attack playbook is configured to create an incident when an event handler generates a denial-of-ser/ice (DoS) attack event.
Why did the DOS attack playbook fail to execute?
Options:
The Create SMTP Enumeration incident task is expecting an integer value but is receiving the incorrect data type
The Get Events task is configured to execute in the incorrect order.
The Attach_Data_To_lncident task failed.
The Attach_Data_To_lncident task is expecting an integer value but is receiving the incorrect data type.
Answer:
AExplanation:
Understanding the Playbook and its Components:
The exhibit shows the status of a playbook named "DOS attack" and its associated tasks.
The playbook is designed to execute a series of tasks upon detecting a DoS attack event.
Analysis of Playbook Tasks:
Attach_Data_To_Incident:Task ID placeholder_8fab0102, status is "upstream_failed," meaning it did not execute properly due to a previous task's failure.
Get Events:Task ID placeholder_fa2a573c, status is "success."
Create SMTP Enumeration incident:Task ID placeholder_3db75c0a, status is "failed."
Reviewing Raw Logs:
The error log shows a ValueError: invalid literal for int() with base 10: '10.200.200.100'.
This error indicates that the task attempted to convert a string (the IP address '10.200.200.100') to an integer, which is not possible.
Identifying the Source of the Error:
The error occurs in the file "incident_operator.py," specifically in the execute method.
This suggests that the task "Create SMTP Enumeration incident" is the one causing the issue because it failed to process the data type correctly.
Conclusion:
The failure of the playbook is due to the "Create SMTP Enumeration incident" task receiving a string value (an IP address) when it expects an integer value. This mismatch in data types leads to the error.
Which FortiAnalyzer feature uses the SIEM database for advance log analytics and monitoring?
Options:
Threat hunting
Asset Identity Center
Event monitor
Outbreak alerts
Answer:
AExplanation:
Understanding FortiAnalyzer Features:
FortiAnalyzer includes several features for log analytics, monitoring, and incident response.
The SIEM (Security Information and Event Management) database is used to store and analyze log data, providing advanced analytics and insights.
Evaluating the Options:
Option A: Threat hunting
Threat hunting involves proactively searching through log data to detect and isolate threats that may not be captured by automated tools.
This feature leverages the SIEM database to perform advanced log analytics, correlate events, and identify potential security incidents.
Option B: Asset Identity Center
This feature focuses on asset and identity management rather than advanced log analytics.
Option C: Event monitor
While the event monitor provides real-time monitoring and alerting based on logs, it does not specifically utilize advanced log analytics in the way the SIEM database does for threat hunting.
Option D: Outbreak alerts
Outbreak alerts provide notifications about widespread security incidents but are not directly related to advanced log analytics using the SIEM database.
Conclusion:
The feature that uses the SIEM database for advanced log analytics and monitoring in FortiAnalyzer isThreat hunting.
Refer to the exhibit.
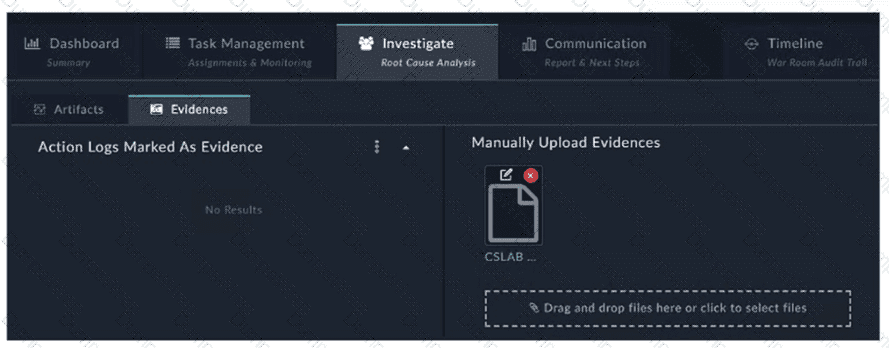
How do you add a piece of evidence to the Action Logs Marked As Evidence area? (Choose one answer)
Options:
By tagging output or a workspace comment with the keyword Evidence
By linking an indicator to the war room
By creating an evidence collection task and attaching a file
By executing a playbook with the Save Execution Logs option enabled
Answer:
AExplanation:
Comprehensive and Detailed Explanation From FortiSOAR 7.6., FortiSIEM 7.3 Exact Extract study guide:
InFortiSOAR 7.6, theWar Roomis a collaborative space designed for high-priority incident investigation. TheEvidencestab within theInvestigateview (as shown in the exhibit) is specifically designed to highlight critical findings found during the investigation process.
Evidence Tagging:To populate theAction Logs Marked As Evidencesection, an analyst must specifically tag a relevant log entry, a playbook output, or a comment within the collaboration workspace with the system-defined keyword"Evidence".
Automatic Categorization:Once the tag is applied, FortiSOAR automatically parses these entries and displays them in this centralized view. This allows team members and stakeholders to quickly view substantiated facts and proof gathered during the "Root Cause Analysis" phase without sifting through all raw action logs.
Manual vs. Action Logs:The exhibit shows two distinct areas: "Manually Upload Evidences" (where files like the CSLAB document shown can be dragged and dropped) and "Action Logs Marked As Evidence." The latter is reserved exclusively for system-generated logs or comments that have been promoted to evidence status via tagging.
Why other options are incorrect:
By linking an indicator to the war room (B):Linking indicators associates technical artifacts (like IPs or hashes) with the record, but it does not automatically classify them as evidence within the War Room action log view.
By creating an evidence collection task and attaching a file (C):While this is a valid step in an investigation, attaching a file to a task typically places it in the "Attachments" or "Manually Upload Evidences" area, rather than the "Action Logs" section specifically.
By executing a playbook with the Save Execution Logs option enabled (D):Saving execution logs ensures a trail of what the playbook did, but it does not mark the output as "Evidence" unless the specific logic or a manual analyst action applies the "Evidence" tag to the resulting log entry.
Exhibit:
Which observation about this FortiAnalyzer Fabric deployment architecture is true?
Options:
The AMER HQ SOC team cannot run automation playbooks from the Fabric supervisor.
The AMER HQ SOC team must configure high availability (HA) for the supervisor node.
The EMEA SOC team has access to historical logs only.
The APAC SOC team has access to FortiView and other reporting functions.
Answer:
AExplanation:
Understanding FortiAnalyzer Fabric Deployment:
FortiAnalyzer Fabric deployment involves a hierarchical structure where the Fabric root (supervisor) coordinates with multiple Fabric members (collectors and analyzers).
This setup ensures centralized log collection, analysis, and incident response across geographically distributed locations.
Analyzing the Exhibit:
FAZ1-Supervisoris located at AMER HQ and acts as the Fabric root.
FAZ2-Analyzeris a Fabric member located in EMEA.
FAZ3-CollectorandFAZ4-Collectorare Fabric members located in EMEA and APAC, respectively.
Evaluating the Options:
Option A:The statement indicates that the AMER HQ SOC team cannot run automation playbooks from the Fabric supervisor. This is true because automation playbooks and certain orchestration tasks typically require local execution capabilities which may not be fully supported on the supervisor node.
Option B:High availability (HA) configuration for the supervisor node is a best practice for redundancy but is not directly inferred from the given architecture.
Option C:The EMEA SOC team having access to historical logs only is not correct since FAZ2-Analyzer provides full analysis capabilities.
Option D:The APAC SOC team has access to FortiView and other reporting functions through FAZ4-Collector, but this is not explicitly detailed in the provided architecture.
Conclusion:
The most accurate observation about this FortiAnalyzer Fabric deployment architecture is that the AMER HQ SOC team cannot run automation playbooks from the Fabric supervisor.
Which statement describes automation stitch integration between FortiGate and FortiAnalyzer?
Options:
An event handler on FortiAnalyzer executes an automation stitch when an event is created.
An automation stitch is configured on FortiAnalyzer and mapped to FortiGate using the FortiOS connector.
An event handler on FortiAnalyzer is configured to send a notification to FortiGate to trigger an automation stitch.
A security profile on FortiGate triggers a violation and FortiGate sends a webhook call to FortiAnalyzer.
Answer:
DExplanation:
Overview of Automation Stitches: Automation stitches in Fortinet solutions enable automated responses to specific events detected within the network. This automation helps in swiftly mitigating threats without manual intervention.
FortiGate Security Profiles:
FortiGate uses security profiles to enforce policies on network traffic. These profiles can include antivirus, web filtering, intrusion prevention, and more.
When a security profile detects a violation or a specific event, it can trigger predefined actions.
Webhook Calls:
FortiGate can be configured to send webhook calls upon detecting specific security events.
A webhook is an HTTP callback triggered by an event, sending data to a specified URL. This allows FortiGate to communicate with other systems, such as FortiAnalyzer.
FortiAnalyzer Integration:
FortiAnalyzer collects logs and events from various Fortinet devices, providing centralized logging and analysis.
Upon receiving a webhook call from FortiGate, FortiAnalyzer can further analyze the event, generate reports, and take automated actions if configured to do so.
Detailed Process:
Step 1: A security profile on FortiGate triggers a violation based on the defined security policies.
Step 2: FortiGate sends a webhook call to FortiAnalyzer with details of the violation.
Step 3: FortiAnalyzer receives the webhook call and logs the event.
Step 4: Depending on the configuration, FortiAnalyzer can execute an automation stitch to respond to the event, such as sending alerts, generating reports, or triggering further actions.
Fortinet Documentation: FortiOS Automation Stitches
FortiAnalyzer Administration Guide: Details on configuring event handlers and integrating with FortiGate.
FortiGate Administration Guide: Information on security profiles and webhook configurations.
By understanding the interaction between FortiGate and FortiAnalyzer through webhook calls and automation stitches, security operations can ensure a proactive and efficient response to security events.
Refer to the exhibits.
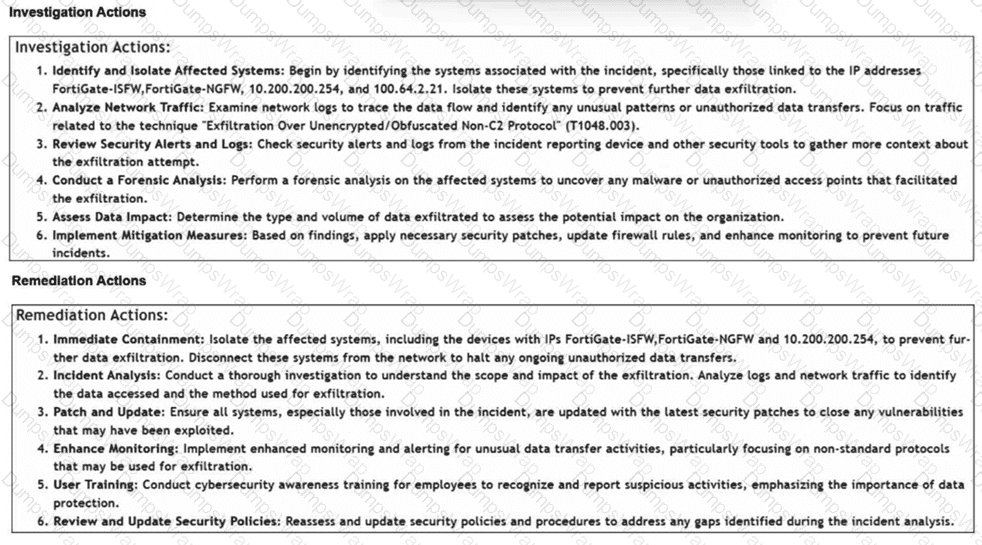
How is the investigation and remediation output generated on FortiSIEM? (Choose one answer)
Options:
By exporting an incident
By running an incident report
By using FortiAI to summarize the incident
By viewing the Context tab of an incident
Answer:
CExplanation:
Comprehensive and Detailed Explanation From FortiSOAR 7.6., FortiSIEM 7.3 Exact Extract study guide:
InFortiSIEM 7.3, a key innovation is the integration ofFortiAI, which provides generative AI capabilities to assist SOC analysts during the triage and response process.
Generative AI Summary:When an incident occurs, FortiAI can automatically analyze the underlying logs, correlation logic, and MITRE ATT&CK techniques (such as "Exfiltration Over Alternative Protocol" shown in the exhibit) to generate a human-readable summary.
Structured Output:The output displayed in the exhibit—specifically the categorizedInvestigation Actions(identifying affected systems, analyzing traffic) andRemediation Actions(immediate containment, patching, user training)—is the typical result of a FortiAI summary request.
Analyst Efficiency:This feature is designed to reduce the "mean time to respond" (MTTR) by providing analysts with immediate, actionable steps without requiring them to manually piece together the recommended response plan from static documentation or disparate log views.
Why other options are incorrect:
Exporting an incident (A):Exporting an incident typically results in a raw data file (CSV/JSON/PDF) containing the log data and metadata, rather than an AI-generated strategic plan for investigation and remediation.
Running an incident report (B):Standard incident reports provide statistical and historical data about incidents over time. They do not dynamically generate specific, numbered investigation steps tailored to the unique context of a single live incident.
Context tab (D):The Context tab in FortiSIEM is primarily used to view theCMDBinformation of the involved assets (e.g., host details, owner, location) and related historical events. While it provides thedataneeded for an investigation, it does not provide thelist of actionsto take.
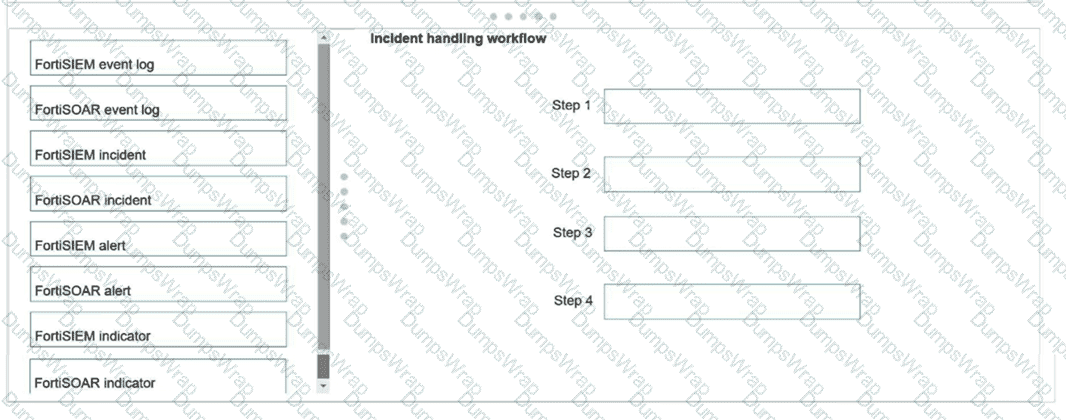
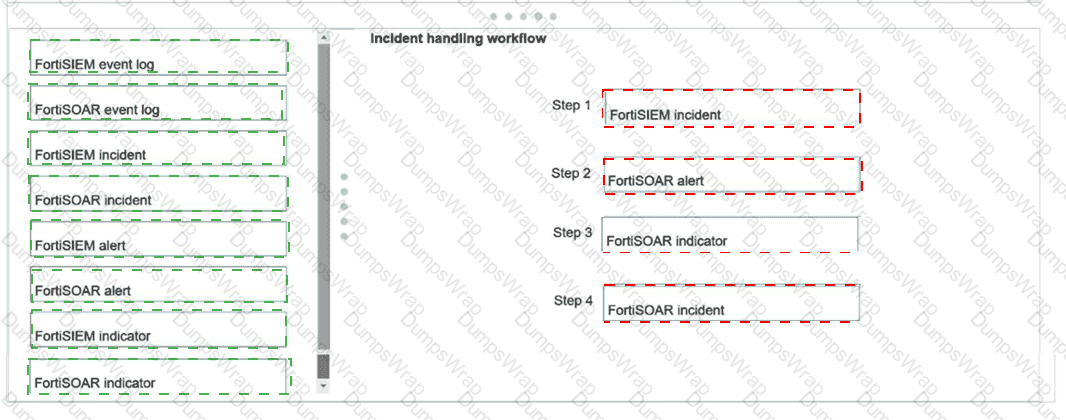
Using the default data ingestion wizard in FortiSOAR, place the incident handling workflow from FortiSIEM to FortiSOAR in the correct sequence. Select each workflow component in the left column, hold and drag it to a blank position in the column on the right. Place the four correct workflow components in order, placing the first step in the first position at the top of the column.
Options:
Answer:
Explanation:
1.FortiSIEM incident2.FortiSOAR alert3.FortiSOAR indicator4.FortiSOAR incident
In the standard integration betweenFortiSIEM 7.3andFortiSOAR 7.6, the data ingestion wizard follows a specific object mapping hierarchy to ensure that high-fidelity security events are managed correctly.
Step 1: FortiSIEM incident:The workflow begins in FortiSIEM. When a correlation rule triggers, it generates anIncident(not just a raw log). The FortiSOAR connector polls the FortiSIEM API specifically for these incident records.
Step 2: FortiSOAR alert:By default, ingested FortiSIEM incidents are mapped to theAlertsmodule in FortiSOAR. This serves as a "triage" layer where automated playbooks can perform initial analysis before a human determines if it warrants a full-scale investigation.
Step 3: FortiSOAR indicator:As the alert is processed (either during ingestion or immediately after), the playbook extracts technical artifacts (IPs, hashes, URLs) and createsIndicatorrecords. This allows for automated threat intelligence lookups and cross-referencing against other alerts.
Step 4: FortiSOAR incident:If the alert is validated (either through automated playbook scoring or manual analyst review), it is promoted to aFortiSOAR Incident. This represents a confirmed security issue that requires formal tracking, remediation, and reporting.
A customer wants FortiAnalyzer to run an automation stitch that executes a CLI command on FortiGate to block a predefined list of URLs, if a botnet command-and-control (C&C) server IP is detected.
Which FortiAnalyzer feature must you use to start this automation process?
Options:
Playbook
Data selector
Event handler
Connector
Answer:
CExplanation:
Understanding Automation Processes in FortiAnalyzer:
FortiAnalyzer can automate responses to detected security events, such as running commands on FortiGate devices.
Analyzing the Customer Requirement:
The customer wants to run a CLI command on FortiGate to block predefined URLs when a botnet C&C server IP is detected.
This requires an automated response triggered by a specific event.
Evaluating the Options:
Option A:Playbooks orchestrate complex workflows but are not typically used for direct event-triggered automation processes.
Option B:Data selectors filter logs based on criteria but do not initiate automation processes.
Option C:Event handlers can be configured to detect specific events (such as detecting a botnet C&C server IP) and trigger automation stitches to execute predefined actions.
Option D:Connectors facilitate communication between FortiAnalyzer and other systems but are not the primary mechanism for initiating automation based on log events.
Conclusion:
To start the automation process when a botnet C&C server IP is detected, you must use anEvent handlerin FortiAnalyzer.
Refer to the exhibit.
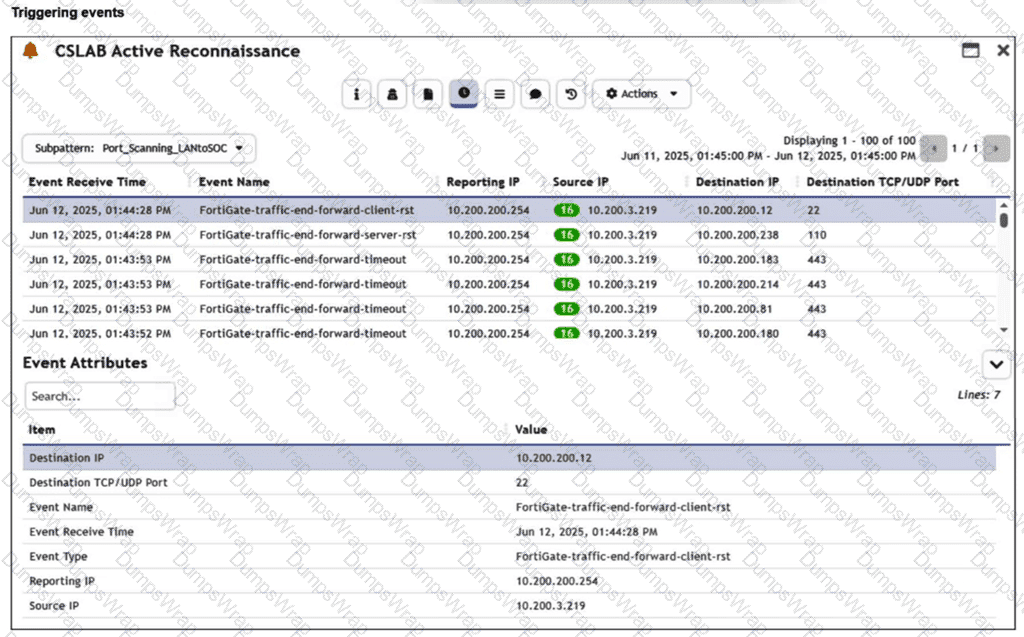
You are reviewing the Triggering Events page for a FortiSIEM incident. You want to remove the Reporting IP column because you have only one firewall in the topology. How do you accomplish this? (Choose one answer)
Options:
Clear the Reporting IP field from the Triggered Attributes section when you configure the Incident Action.
Disable correlation for the Reporting IP field in the rule subpattern.
Remove the Reporting IP attribute from the raw logs using parsing rules.
Customize the display columns for this incident.
Answer:
DExplanation:
Comprehensive and Detailed Explanation From FortiSOAR 7.6., FortiSIEM 7.3 Exact Extract study guide:
InFortiSIEM 7.3, theTriggering Eventsview is a dynamic table that displays the individual logs that caused a specific rule to fire. To manage the visibility of data within this specific view:
Interface Customization:The "Triggering Events" tab includes a column management feature. By clicking on the column headers or the table settings icon (typically found at the top right of the event list), an analyst cancustomize the display columns. This allows the user to uncheck the "Reporting IP" attribute, effectively hiding it from the view without altering the underlying data or rule logic.
Operational Efficiency:This is a common task in environments with a simplified topology where the "Reporting IP" is redundant information. Customizing the view helps the analyst focus on the most relevant data points, such as "Source IP," "Destination IP," and "Destination Port."
Why other options are incorrect:
A (Incident Action):Clearing a field from the Incident Action configuration affects what data is sent in an email alert or passed to a SOAR platform, but it does not change the layout of the FortiSIEM GUI "Triggering Events" page.
B (Disable Correlation):Disabling correlation for an attribute determines whether that attribute is used by the rules engine to group events. It does not control the visual display of columns in the incident dashboard.
C (Parsing Rules):Removing attributes via parsing rules is a destructive process that prevents the SIEM from indexing that data entirely. This would make the "Reporting IP" unavailable for all searches and reports, which is excessive for a simple display preference.
Which three are threat hunting activities? (Choose three answers)
Options:
Enrich records with threat intelligence.
Automate workflows.
Generate a hypothesis.
Perform packet analysis.
Tune correlation rules.
Answer:
A, C, DExplanation:
Comprehensive and Detailed Explanation From FortiSOAR 7.6., FortiSIEM 7.3 Exact Extract study guide:
According to the specialized threat hunting modules and frameworks withinFortiSOAR 7.6and the advanced analytics capabilities ofFortiSIEM 7.3, threat hunting is defined as a proactive, human-led search for threats that have bypassed automated security controls. The three selected activities are core components of this lifecycle:
Generate a hypothesis (C):This is the fundamental starting point of a "Structured Hunt." Analysts develop a testable theory—based on recent threat intelligence (such as a new TTP identified by FortiGuard) or environmental risk—about how an attacker might be operating undetected in the network.
Enrich records with threat intelligence (A):During the investigation phase, hunters use theThreat Intelligence Management (TIM)module in FortiSOAR to enrich technical data (IPs, hashes, URLs) with external context. This helps determine if an anomaly discovered during the hunt is indeed malicious or part of a known campaign.
Perform packet analysis (D):Since advanced threats often live in the "gaps" between log files, hunters frequently perform deep-packet or network-flow analysis using FortiSIEM’s query tools or integrated NDR (Network Detection and Response) data to identify suspicious lateral movement or C2 (Command and Control) communication patterns that standard alerts might miss.
Why other options are excluded:
Automate workflows (B):While SOAR is designed for automation, the act of "automating" is a DevOps or SOC engineering task. Threat hunting itself is a proactive investigation; while playbooks canassista hunter (e.g., by automating the data gathering), the act of hunting remains a manual or semi-automated cognitive process.
Tune correlation rules (E):Tuning rules is areactivemaintenance task or a "post-hunt" activity. Once a threat hunter finds a new attack pattern, they will then tune SIEM correlation rules to ensure that specific threat is detected automatically in the future. The tuning is theresultof the hunt, not the activity of hunting itself.
Refer to Exhibit:
A SOC analyst is creating the Malicious File Detected playbook to run when FortiAnalyzer generates a malicious file event. The playbook must also update the incident with the malicious file event data.
What must the next task in this playbook be?
Options:
A local connector with the action Update Asset and Identity
A local connector with the action Attach Data to Incident
A local connector with the action Run Report
A local connector with the action Update Incident
Answer:
DExplanation:
Understanding the Playbook and its Components:
The exhibit shows a playbook in which an event trigger starts actions upon detecting a malicious file.
The initial tasks in the playbook include CREATE_INCIDENT and GET_EVENTS.
Analysis of Current Tasks:
EVENT_TRIGGER STARTER: This initiates the playbook when a specified event (malicious file detection) occurs.
CREATE_INCIDENT: This task likely creates a new incident in the incident management system for tracking and response.
GET_EVENTS: This task retrieves the event details related to the detected malicious file.
Objective of the Next Task:
The next logical step after creating an incident and retrieving event details is to update the incident with the event data, ensuring all relevant information is attached to the incident record.
This helps SOC analysts by consolidating all pertinent details within the incident record, facilitating efficient tracking and response.
Evaluating the Options:
Option A:Update Asset and Identity is not directly relevant to attaching event data to the incident.
Option B:Attach Data to Incident sounds plausible but typically, updating an incident involves more comprehensive changes including status updates, adding comments, and other data modifications.
Option C:Run Report is irrelevant in this context as the goal is to update the incident with event data.
Option D:Update Incident is the most suitable action for incorporating event data into the existing incident record.
Conclusion:
The next task in the playbook should be to update the incident with the event data to ensure the incident reflects all necessary information for further investigation and response.