
Salesforce Certified CRM Analytics and Einstein Discovery Consultant Questions and Answers
The below image shows a numeric outcome being deployed (Regression).

Which metric is used to calculate the performance of the model in production, specifically in the Model Manager?
The below image shows a numeric outcome being deployed (Regression).
Which metric is used to calculate the performance of the model in production, specifically in the Model Manager?
Universal Containers (UC) is using CRM Analytics to create two datasets.
* Dataset A: Contains a list of activities with an "activityID" dimension and a "userID" dimension
* Dataset B: Contains a list of users with a "userID" dimension
UC wants to delete all activities from Dataset A related to users in Dataset B.
How should the CRM Analytics consultant help UC achieve this?
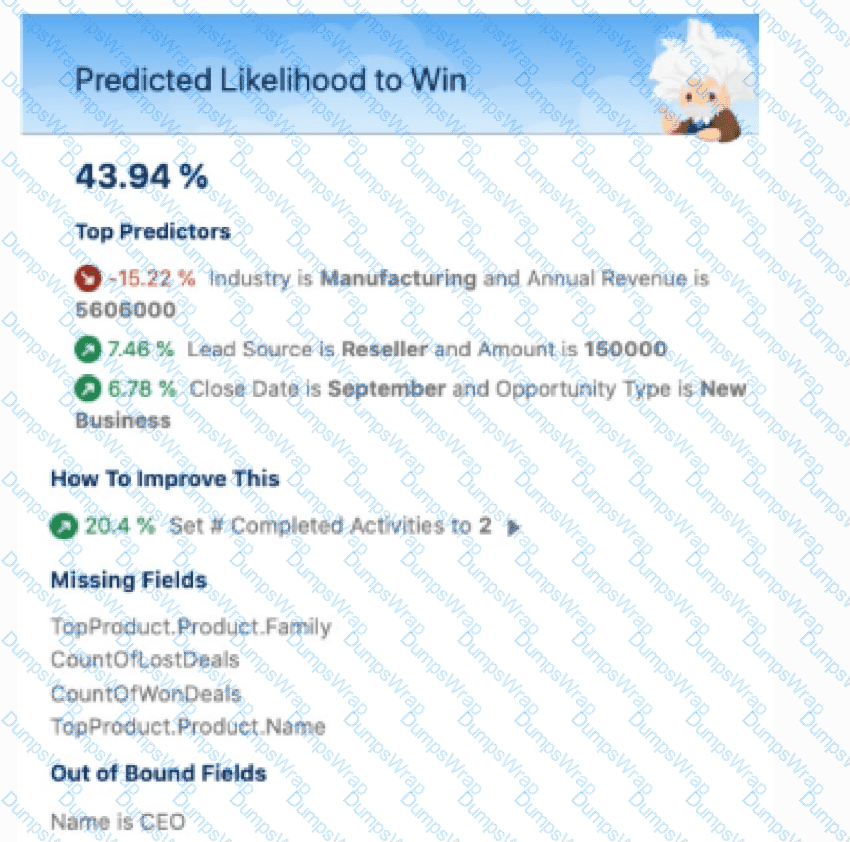
For a story created using multiple data sources (Salesforce, CSV, and external data), what is a possible fix for the issue shown in the prediction?
Cloud Kicks (CK) has a dashboard that is still showing 10 former account managers. CK has since expanded, and some have moved from their former roles. CK wants the dashboard to reflect current account managers and stay up to date as new team members join.
How should the CRM Analytics developer accomplish this?
A CRM Analytics consultant at Cloud Kicks wants to create a new dashboard that uses custom GeoJSON to display data; however, they are unable to upload the file via the user interface (UI).
Which action should the consultant take?
A client has two datasets that are used across seven different dashboards. Three of these dashboards are used by marketing and four are used by sales. The client requires that only marketing can
access the marketing dashboards and only sales can access the sales dashboards.
Which solution should a consultant recommend?
A CRM Analytics consultant is building a dashboard for Cloud Kicks that is embedded in a separate Lightning page called "Management Dashboard" using a CRM Analytics Dashboard Component. The system administrator and the contract manager should both have access. The system administrator is able to see the dashboard and the data, but the contract manager sees a blank Lightning page.
What is causing the issue?
Cloud Kicks has informed CRM Analytics developers that they have two scenarios with restricted row-level security.
The parameters being:
1. Non-CXOs and VPs working in EMEA can have access to EMEA records only.
2. CXOs and VPs should have access to all data irrespective of the region (APAC, EMEA, etc.).
Which sharing method works for this scenario?
A project team member uploads a CSV file to CRM Analytics, and they notice a few records failed during the upload. The manager wants to view the error log generated so this can be fixed and uploaded again. The manager has the CRM Analytics administrator permissionbut is unable to download the error log details.
Why is the manager unable to download the log details?
The CRM Analytics consultant at Universal Containers (UC) has set up data sync for the Salesforce Opportunity object with the Amount currency field added. This is being used in multiple datasets and dashboards, as UC is a multi-currency organization.
The currency used in Salesforce records is set up in GBP but the data on the dashboard is converting to USD. Conversion logic is not set up on any of the recipes.
Why is the currency converting?
A manager at Cloud Kicks asks for data in a dashboard to be refreshed after the sync of an external connection to Google BigQuery.
How should the consultant accomplish this?
Universal Containers (UC) is looking to create a dashboard for whitespace analysis. UC wants to view a particularcustomer and see what similarcustomers have bought.
Which recipe transformation is helpful for the consultant to use while creating the dataset?
A CRM Analytics consultant is updating an existing recipe.
They are looking to add a few additional fields onto the Account dataset. One of the fields to be added is a multi-select picklist field that needs to be shown as text on the dashboard.
What should the consultant do to accomplish this?
A consultant is preparing a dataset to predict customer lifetime value and is collecting data from a questionnaire that asks for demographic information. A very small number of respondents fill in the Income box, but the consultant thinks that it is an informative column even though it only represents 1% of respondents.
What should the consultant do?
An CRM Analytics consultant is working with Ursa Major Solar to build a dashboard to understand customer renewals. Each subscription is captured as a Closed Won Opportunity within Salesforce and asingle Account should only have one active subscription. The consultant notices the Opportunity record does NOT specify whether it is a renewal or a net new subscription.
Which data transformation should the consultant use to determine if a subscription is new or a renewal?
Several users are complaining they are unable to see a specific dashboard on a Salesforce Lightning page anymore. The CRM Analytics consultant logs in as one of the users and sees an error
page once the dashboard is opened.
How should the consultant solve this issue?
Universal Containers (UC) creates a dataset, "Book11", containing a budget per region per month for the first 6 months of the year, as shown in the graphic below. Now, UC wants to create a lens showing
the total budget for each region for each month. Every combination of region and month must be shown in the lens, even if there is no data.
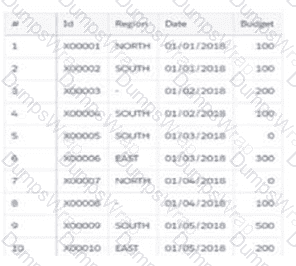
How should a CRM Analytics consultant help UC build this lens?
A user is able to access the dashboards, lenses, and datasets of a particular app but is unable to change the name of the specific app.
What is causing the issue?
Universal Containers’ CRM Analytics team is building a dashboard with two widgets.
1. List widget associated to the query "Type_2" and grouped by the dimension "Type" (multi-selection)
2. Donut chart widget associated to the query "Step_pie_3" and grouped by the dimension "Type"
The team wants to use bindings/interactions so any selection in the List widget will filter the Donut chart. The queries use different datasets,
and users should be able to choose more than one Type (multi-selection).
What is the right syntax for the binding/interaction?
A)
B)
C)

The sales team at Cloud Kicks is requesting that datasets for their dashboards be refreshed every hour. The CRM Analytics consultant investigates if this is possible and finds that the dashboards use five datasets created from two recipes. The first recipe takes 43 minutes to run and the second recipe takes 25 minutes to run.
Which consideration should the consultant keep in mind?
Cloud Kicks (CK) wants to use CRM Analytics to analyze trends of its sales pipeline in order to accelerate the company's sales process. To do so, CK needs to know the average time an opportunity
spends in each stage. The data can be found in the Opportunity History object, but the value is not pre-calculated in Salesforce, so a consultant recommends using a recipe to calculate it.
How should the consultant use a recipe to calculate the average time an opportunity spends in each stage?
Universal Containers has a single dataset that contains the attainment and commission fields for all sales reps. Each sales rep should be able view the attainment data for each rep in their division. Each repshould only be able to see their own commission data.
Which option should a CRM Analytics consultant use to enforce this requirement?
Universal Containers has a well-defined role hierarchy in Salesforce where everyone is assigned to an appropriate node. The accounts within their instance are categorized by their demography.
An individual sales rep should be able to view all accounts that they own. In addition, sales reps should be able to see any accounts where the value of the account demography matches the demography defined on their user record. A user could have more than one demography defined on their user record.
To meet this requirement, the CRM Analytics consultant has set up a security predicate of the existing 'Account' dataset as follows:
This, however, does not seem to be working as expected.
What is causing the issue?
A CRM Analytics administrator is working on deploying a dataflow and a dataset (generated by this dataflow) to another org.
While creating a change set, they notice that the components are NOT visible to be included in the change set.
What is the reason for this?
Universal Containers builds a new sales dashboard and wants to makesure account managers can access the dashboard while traveling.
What should the consultant consider doing in this process?
A consultant is building a CRM Analytics dashboard for Universal
Containers. The consultant has enabled data sync to increase the
speed of datasets refreshing.
How often will the data on the dashboard be refreshed?
A consultant runs the sharing inheritance coverage assessment for the Opportunity object and finds that some records exceed 400 sharing descriptors.
What should the consultant do?
The sole manager of a CRM Analytics app at Cloud Kicks is leaving the company.
What should the CRM Analytics consultant do to ensure the app remains accessible?
Universal Containers (UC) has a "Sales Manager” dashboard. UC has a compare table that has multiple groupings and columns added showing the Total and Subtotals of the numeric values. A consultant is
asked to add additional groups to enhance details about UC's customers.
Which feature should the consultant use to make the navigation of the compare tables easier for the end user?
In Data Alerts, a field named Region is 96.5% North America. The consultant believes that this is an important field since the majority of sales is in the North American market.
What is the appropriate action?
A consultant creates a CRM Analytics dashboard in a sandbox and it needs to be migrated into production.
What should the consultant use to complete the migration?
Universal Containers has a dashboard for sales managers. They need to visualize the percentage of their opportunities in the pipeline in a Gauge chart. They want to customize the chart to keep track if they are below or beyond the target.
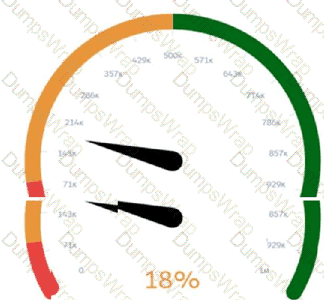
Which widget parameters should a consultant use?
Which recommended technique should a CRM Analytics consultant
use to access CRM Analytics data from a remote app or website?
Cloud Kicks (CK) has a dashboard in CRM Analytics with forecasting data. One widget is a compare table using the timeseries function showing the quarterly forecast. However, CK is interested in enhancing the dashboard with a weekly forecast per customer.
How should CK achieve this?
