Salesforce Certified Tableau Consultant Questions and Answers
A client wants to grant a user access to a data source hosted on Tableau Server so that the user can create new content in Tableau Desktop. However, the user should be restricted to seeing only a subset of approved data.
How should the client set up the filter before publishing the hyper file so that the Desktop user follows the same row-level security (RLS) as viewers of the end content?
A consultant used Tableau Data Catalog to determine which workbooks will be affected by a field change.
Catalog shows:
Published Data Source → 7 connected workbooks
Field search (Lineage tab) → 6 impacted workbooks
The client asks: Why 7 connected, but only 6 impacted?
A client has a pipeline dashboard that takes a long time to load. The dashboard is connected to only one large data source that is an extract.
It contains two calculated fields:
. TOTAL([Opportunities])
· SUM([Value])
It also contains two filters:
. A Relative Date filter on Created Date, a Date field containing values from 5 years ago until today
. A Multiple Values (Dropdown) filter on Account Name, a String field containing 1,000 distinct values
A consultant creates a Performance Recording to troubleshoot the issue, and finds out that the longest-running event is "Executing Query."
Which step should the consultant take to resolve this issue?
A business analyst needs to create a view in Tableau Desktop that reports data from both Excel and MSSQL Server.
Which two features should the business analyst use to create the view? Choose two.
A consultant migrated a data source to improve performance. The consultant wants to identify which workbooks need to be updated to point to the new data
source.
Which Tableau tool should the consultant use?
A client is evaluating which user roles to assign to managers. The managers need to view dashboards, create Data-Driven Alerts, and perform ad hoc analysis of existing Tableau data sources. A consultant must provide a solution that minimizes licensing costs.
Which role should the consultant recommend be assigned to the managers?
A data analyst sets up a calculation to filter a dashboard so that it displays only the users' information. The dashboard will then be published to Tableau Cloud.
The data analyst plans to use the following calculation to filter the data: USERNAME() = [Correct Answer]
Which column in the table below should the data analyst reference in the calculation?

A Tableau consultant is tasked with choosing a method of setting up row-level security (RLS) entitlements with tables during a Tableau implementation. The consultant has received a set of roles from a client in one normalized table, and a set of entitlements from the client in another normalized table.
The consultant plans on using the deepest granularity method. However, when the consultant gains access to the final set of data, they discover duplicate values at the lowest level. Most of the regions in the client's dataset contain sub-regions named 'East' and 'West'. However, some regions have a 'Null' value for sub-region.

How should the consultant proceed?
A consultant is tasked with improving the performance of a large workbook that contains multiple dashboards, each of which leverages a separate data source. What is one way to improve performance?
A consultant wants to improve the performance of reports by moving calculations to the data layer and materializing them in the extract.
Which type of calculation is the consultant able to move?
A client notices that several groups are sharing content across divisions and are not complying with their data governance strategy. During a Tableau Server
audit, a consultant notices that the asset permissions for the client's top-level projects are set to "Locked," but that "Apply to Nested Projects" is not checked.
The consultant recommends checking "Apply to Nested Projects" to enforce compliance.
Which impact will the consultant's recommendation have on access to the existing nested projects?
A client is using the Tableau Content Migration Tool to move content from an old Tableau Server to a new Tableau Server.
Which content will need to be moved using a different tool or process?
A client collects information about a web browser customers use to access their website. They then visualize the breakdown of web traffic by browser version.
The data is stored in the format shown below in the related table, with a NULL BrowserID stored in the Site Visitor Table if an unknown browser version
accesses their website.
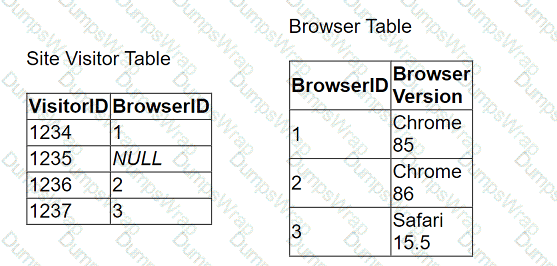
The client uses "Some Records Match" for the Referential Integrity setting because a match is not guaranteed. The client wants to improve the performance of
the dashboard while also getting an accurate count of site visitors.
Which modifications to the data tables and join should the consultant recommend?
A client has a large data set that contains more than 10 million rows.
A consultant wants to calculate a profitability threshold as efficiently as possible. The calculation must classify the profits by using the following specifications:
. Classify profit margins above 50% as Highly Profitable.
. Classify profit margins between 0% and 50% as Profitable.
. Classify profit margins below 0% as Unprofitable.
Which calculation meets these requirements?
A client is considering migrating from Tableau Server to Tableau Cloud.
Which two elements are determining factors of whether the client should use Tableau Server or Tableau Cloud? Choose two.
A client has many published data sources in Tableau Server. The data sources use the same databases and tables. The client notices different departments
give different answers to the same business questions, and the departments cannot trust the data. The client wants to know what causes data sources to return
different data.
Which tool should the client use to identify this issue?
An online sales company has a table data source that contains Order Date. Products ship on the first day of each month for all orders from the previous month.
The consultant needs to know the average number of days that a customer must wait before a product is shipped.
Which calculation should the consultant use?
A client wants to see the average number of orders per customer per month, broken down by region. The client has created the following calculated field:
Orders per Customer: {FIXED [Customer ID]: COUNTD([Order ID])}
The client then creates a line chart that plots AVG(Orders per Customer) over MONTH(Order Date) by Region. The numbers shown by this chart are far higher
than the customer expects.
The client asks a consultant to rewrite the calculation so the result meets their expectation.
Which calculation should the consultant use?
A Tableau Cloud client has requested a custom dashboard to help track which data sources are used most frequently in dashboards across their site.
Which two actions should the client use to access the necessary metadata? Choose two.
For a new report, a consultant needs to build a data model with three different tables, including two that contain hierarchies of locations and products. The third
table contains detailed warehousing data from all locations across six countries. The consultant uses Tableau Cloud and the size of the third table excludes
using an extract.
What is the most performant approach to model the data for a live connection?
From the desktop, open the CC workbook.
Open the Manufacturers worksheet.
The Manufacturers worksheet is used to
analyze the quantity of items contributed by
each manufacturer.
You need to modify the Percent
Contribution calculated field to use a Level
of Detail (LOD) expression that calculates
the percentage contribution of each
manufacturer to the total quantity.
Enter the percentage for Newell to the
nearest hundredth of a percent into the
Newell % Contribution parameter.
From the File menu in Tableau Desktop, click
Save.
From the desktop, open the CC workbook.
Open the City Pareto worksheet.
You need to complete the Pareto chart to show the percentage of sales compared to the percentage of cities. The chart must show references lines to visualize how the data compares to the Pareto principle.
From the File menu in Tableau Desktop, click Save.
From the desktop, open the CC workbook.
Open the Incremental worksheet.
You need to add a line to the chart that
shows the cumulative percentage of sales
contributed by each product to the
incremental sales.
From the File menu in Tableau Desktop, click
Save.
From the desktop, open the CC workbook. Use the US Population Estimates data source.
You need to shape the data in US Population Estimates by using Tableau Desktop. The data must be formatted as shown in the following table.
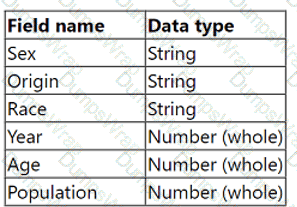
Open the Population worksheet. Enter the total number of records contained in the data set into the Total Records parameter.
From the File menu in Tableau Desktop, click Save.
Use the following login credentials to sign in
to the virtual machine:
Username: Admin
Password:
The following information is for technical
support purposes only:
Lab Instance: 40201223
To access Tableau Help, you can open the
Help.pdf file on the desktop.
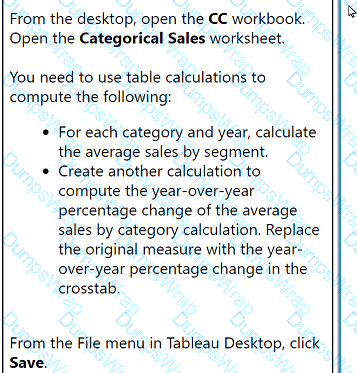
From the desktop, open the CC workbook.
Open the Categorical Sales worksheet.
You need to use table calculations to
compute the following:
. For each category and year, calculate
the average sales by segment.
. Create another calculation to
compute the year-over-year
percentage change of the average
sales by category calculation. Replace
the original measure with the year-
over-year percentage change in the
crosstab.
From the File menu in Tableau Desktop, click
Save.
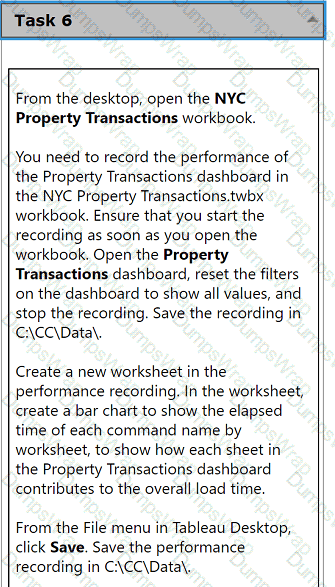
From the desktop, open the NYC
Property Transactions workbook.
You need to record the performance of
the Property Transactions dashboard in
the NYC Property Transactions.twbx
workbook. Ensure that you start the
recording as soon as you open the
workbook. Open the Property
Transactions dashboard, reset the filters
on the dashboard to show all values, and
stop the recording. Save the recording in
C:\CC\Data\.
Create a new worksheet in the
performance recording. In the worksheet,
create a bar chart to show the elapsed
time of each command name by
worksheet, to show how each sheet in
the Property Transactions dashboard
contributes to the overall load time.
From the File menu in Tableau Desktop,
click Save. Save the performance
recording in C:\CC\Data\.