
SnowPro Advanced: Data Analyst Exam Questions and Answers
What scheme is used by Snowflake to estimate the approximate similarity between two or more data sets?
Options:
MINHASH
APPROX_PERCENTILE
HyperLogLog
APPROX_TOP_K
Answer:
AExplanation:
Snowflake provides several "approximate" functions designed to handle massive scale with high efficiency. While HyperLogLog (HLL) is the standard for estimating cardinality (unique counts), and APPROX_TOP_K is used for frequency estimation, the specific task of determining the similarity between two sets relies on a different probabilistic algorithm.
The MINHASH function is Snowflake's implementation for estimating the Jaccard similarity coefficient between two or more sets. Jaccard similarity is defined as the size of the intersection divided by the size of the union of the sample sets. Calculating an exact Jaccard similarity on billions of rows would be computationally expensive. MINHASH solves this by creating a "signature"—a small, fixed-size binary representation of the data. By comparing these signatures rather than the raw data, Snowflake can efficiently estimate how similar the original datasets are.
Evaluating the Options:
Option B (APPROX_PERCENTILE) is used to estimate the value at a specific percentile (e.g., the 95th percentile of latency).
Option C (HyperLogLog) is used for estimating cardinality (the number of unique elements), not the similarity between sets.
Option D (APPROX_TOP_K) identifies the most frequent elements in a dataset.
Option A is the 100% correct answer. It is the specific function built into Snowflake for similarity estimation using the MinHash scheme.
A Data Analyst has created a custom filter called branch_region on a Snowflake dashboard. The filter contains a list of regions where the company has stores. How should the filter be referenced in dashboard queries?
Options:
::branch_region
$branch_region
:branch_region
%branch_region
Answer:
CExplanation:
In Snowsight, Snowflake's modern web interface, interactivity is driven by Dashboard Filters. When an analyst defines a filter, it serves as a dynamic variable that users can manipulate to update visualizations. To incorporate these filters into the SQL logic of a dashboard tile, Snowflake utilizes the colon prefix (:) syntax.
Referencing the filter as :branch_region tells the Snowflake query engine to replace that placeholder with the value(s) selected in the dashboard UI at runtime. This is consistent with how other system filters, such as :daterange, are implemented to ensure all tiles on a dashboard remain synchronized. Using this syntax allows the same query to be repurposed for different regions without manual code changes, significantly reducing the maintenance burden for the Data Analyst.
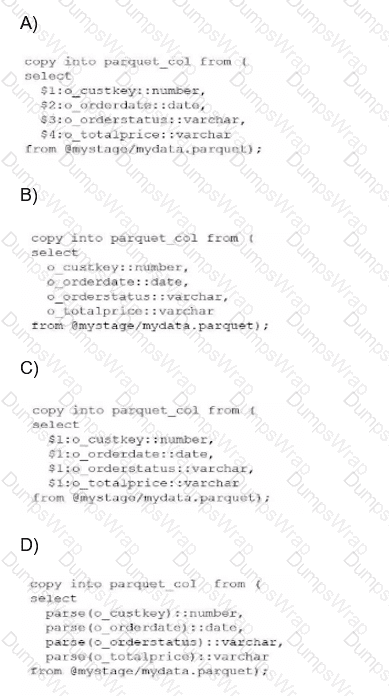
A Data Analyst has a Parquet file stored in an Amazon S3 staging area. Which query will copy the data from the staged Parquet file into separate columns in the target table?
Options:
Option A
Option B
Option C
Option D
Answer:
CExplanation:
In the Snowflake ecosystem, Parquet is treated as a semi-structured data format. When you stage a Parquet file, Snowflake does not automatically parse it into multiple columns like it might with a flat CSV file. Instead, the entire content of a single row or record is loaded into a single VARIANT column, which is referenced in SQL using the positional notation $1.
The fundamental mistake often made—and represented in Option A—is treating Parquet as a delimited format where $1, $2, and $3 refer to different columns. In Parquet ingestion, columns $2 and beyond will return NULL because the schema is contained within the object in $1.
To successfully "shred" or flatten this semi-structured data into a relational table with separate columns, an analyst must use path notation. This involves referencing the root object ($1), followed by a colon (:), and then the specific element key (e.g., $1:o_custkey). Furthermore, because the values extracted from a Variant are technically still Variants, they must be explicitly cast to the correct data type using the double-colon syntax (e.g., ::number, ::date) to ensure they land in the target table with the correct data types.
Evaluating the Options:
Option A is incorrect because it uses positional references ($2, $3, etc.) which are only valid for structured files like CSVs.
Option B is incorrect because it attempts to reference keys directly without the required stage variable ($1) and colon separator.
Option D is incorrect as it uses a non-standard parse() function that does not exist for this purpose in Snowflake SQL.
Option C is the 100% correct syntax. It correctly identifies that the Parquet data resides in $1, utilizes the colon to access internal keys, and applies the necessary type casting. This specific method is known as "Transformation During Ingestion" and is a core competency for any SnowPro Advanced Data Analyst.
A Data Analyst needs a sample of 10 rows from a table FCT_SALES that has billions of rows. Which commands can be used to accomplish this? (Select TWO).
Options:
SELECT * FROM FCT_SALES SAMPLE 10;
SELECT * FROM FCT_SALES SAMPLE (10 ROWS);
SELECT TOP 10 ROWS * FROM FCT_SALES;
SELECT TOP 10 * FROM FCT_SALES;
SELECT TOP (10 ROWS) * FROM FCT_SALES;
Answer:
B, DExplanation:
When dealing with massive datasets containing billions of rows, efficiency is paramount. Snowflake provides two primary ways to retrieve a small subset of data: Sampling and Result Set Limiting.
The SAMPLE clause is used to return a subset of rows based on a specific count or percentage. The correct syntax for specifying a fixed number of rows is SAMPLE (
The TOP <n> or LIMIT <n> clauses are used to restrict the number of rows returned in the output. The TOP
Evaluating the Options:
Option A is incorrect syntax; the ROWS keyword and parentheses are required for a fixed count.
Option B is Correct; it uses the standard Snowflake SAMPLE syntax for a specific row count.
Option C and Option E are incorrect because ROWS is not a valid keyword within a TOP clause in Snowflake.
Option D is Correct; it uses the standard TOP
By using these methods, a Data Analyst ensures they are not wasting compute resources (Credits) by pulling billions of unnecessary rows into the UI or a local environment.
A Data Analyst wants to transform query results. Which transformation option will incur compute costs?
Options:
Showing a thousand separator for numeric columns.
Sorting a column by using the column options.
Increasing or decreasing decimal precision.
Formatting date and timestamp columns.
Answer:
BExplanation:
In the Snowflake Snowsight interface, it is critical to distinguish between UI-level formatting and engine-level processing. Snowsight provides several client-side features that allow an analyst to change how data is displayed without re-executing the underlying SQL query or utilizing virtual warehouse credits.
Client-Side (No Compute Cost):
Formatting options such as adding thousand separators (Option A), adjusting the visible decimal precision (Option C), or changing the display format of dates and timestamps (Option D) are typically handled by the Snowsight web interface itself. These transformations are applied to the data that has already been retrieved into the browser's local result cache. Because they do not require the virtual warehouse to scan micro-partitions or perform new calculations, they do not incur additional compute costs.
Engine-Level (Incurs Compute Cost):
Sorting a column (Option B) is fundamentally different. While Snowsight allows you to click a column header to sort, this action frequently triggers a re-query or a secondary processing step if the entire result set is not already fully cached in the browser's memory. When you use "column options" to perform operations like sorting, filtering, or grouping on large datasets, Snowflake often has to leverage the virtual warehouse to reorganize the data. In the context of the Snowflake Data Analyst exam, sorting is identified as a transformation that requires active compute resources because the engine must evaluate the entire dataset to determine the new order of records.
Furthermore, even if a small result set is cached, complex sorting across large volumes of data necessitates warehouse involvement to ensure accuracy and handle "spilling" to local or remote storage if the sort operation exceeds available memory. Therefore, while visual "masks" are free, structural data reorganization like sorting is a compute-intensive task.
What functions should a Data Analyst use to run descriptive analytics on a data set? (Select TWO).
Options:
REGR_INTERCEPT
REGR_SLOPE
ROW_NUMBER
APPROX_COUNT_DISTINCT
AVG
Answer:
D, EExplanation:
Descriptive analytics is the process of using historical data to understand "what happened." This typically involves summarizing large datasets into interpretable chunks using central tendency, dispersion, and frequency measures.
AVG (Average) is a cornerstone of descriptive statistics. It provides the arithmetic mean of a numeric column, allowing an analyst to understand the "typical" value within a dataset (e.g., Average Order Value).
APPROX_COUNT_DISTINCT is a descriptive tool used to understand the volume of unique entities within a dataset (e.g., "How many unique customers visited the site?"). Similar to HLL mentioned earlier, this function provides a fast summary of data volume and variety, which is a primary goal of the descriptive phase of analysis.
Evaluating the Options:
Options A and B (REGR_INTERCEPT and REGR_SLOPE) are used for linear regression. These fall under Predictive Analytics, as they are used to model relationships and predict future outcomes, rather than just describing current data.
Option C (ROW_NUMBER) is a window function used for data ranking and ordering, but it does not provide a descriptive summary of the dataset's characteristics.
Options D and E are correct because they provide summary statistics (mean and cardinality) that define the "state" of the data, which is the definition of descriptive analytics.
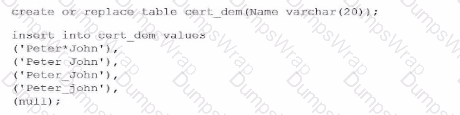
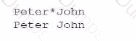
The following code is run:
Then this statement is executed:
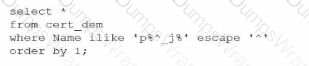
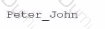
What will be the output of this statement?
A)
B)
C)

D)

Options:
Option A
Option B
Option C
Option D
Answer:
CExplanation:
To determine the correct output, a Data Analyst must understand the behavior of the ILIKE operator, wildcard characters, and the ESCAPE clause in Snowflake.
1. Pattern Matching with ILIKE: The ILIKE operator performs case-insensitive pattern matching. The provided pattern is 'p%^_j%'.
p: The string must start with the letter 'P' or 'p'.
%: This wildcard matches any sequence of zero or more characters.
^_: The ESCAPE '^' clause identifies the caret symbol as an escape character. This means the underscore (_) immediately following it is treated as a literal character rather than its usual wildcard function (which matches any single character).
j: The letter 'J' or 'j' must follow the literal underscore.
%: Matches any trailing sequence of characters.
2. Evaluating the Data: Applying this logic to the values in the cert_dem table:
'Peter*John': While it starts with 'P' and contains 'J', it lacks the required literal underscore. No match.
'Peter John': Contains a space instead of an underscore. No match.
'Peter_John': Starts with 'P', contains a literal underscore, and is followed by 'J'. Match.
'Peter_john': Because the operator is ILIKE (case-insensitive), the lowercase 'j' is accepted. Match.
null: Comparisons with NULL using LIKE or ILIKE always return NULL (unknown), so it is excluded from the results.
3. Ordering the Results: The query includes ORDER BY 1, which sorts the results alphabetically based on the first column. Between 'Peter_John' and 'Peter_john', the standard sort order typically places uppercase before lowercase in most Snowflake collations.
Evaluating the Options (image_829269.png):
Option A incorrectly excludes the case-insensitive match.
Option B incorrectly identifies values that lack the literal underscore.
Option D incorrectly includes values that do not meet the escaped underscore requirement.
Option C is the 100% correct result set, displaying both versions of 'Peter_John' that contain the literal underscore.
What does the "SQL keyword" refer to in the context of adding filters to a worksheet?
Options:
The name of the function used to generate the filter
The filter name to be inserted into queries
The table name containing the static filter "key" values
The name of a User-Defined Function (UDF) used to define the filter "key" values
Answer:
BExplanation:
In Snowsight (Snowflake's web interface), Data Analysts can create interactive dashboards and worksheets using Filters. When you define a filter (such as a Date Range or a list of Regions), you must assign it a SQL Keyword.
This "SQL Keyword" acts as a variable placeholder within your SQL code. For example, if you create a filter for "Customer Region" and set the SQL keyword to :my_region, you can then write a query like: SELECT * FROM sales WHERE region = :my_region. When a user interacts with the UI and selects "North America" from the dropdown, Snowsight automatically injects "North America" into every instance where :my_region appears in the worksheet's SQL.
Evaluating the Options:
Option A is incorrect because the keyword is a label/variable, not the underlying function code.
Option C and Option D are incorrect as they confuse the data source of the filter values with the reference name used in the SQL code.
Option B is the correct answer. The SQL Keyword is specifically the identifier (prefixed with a colon in the code) that allows the analyst to link the UI element (the filter) to the execution logic of the query. This is a fundamental skill for the Data Presentation and Data Visualization domain, ensuring reports are dynamic and user-friendly.
A Data Analyst is working with a table that has 1 record per day, with sales information. Which window function would calculate a 7-day moving average of sales, where SALES_DATE represents the date column?
Options:
SUM(SALES) OVER (ORDER BY SALES_DATE ROWS BETWEEN 6 PRECEDING AND CURRENT ROW)
SUM(SALES) OVER (ORDER BY SALES_DATE ROWS BETWEEN 7 PRECEDING AND CURRENT ROW)
AVG(SALES) OVER (ORDER BY SALES_DATE ROWS BETWEEN 6 PRECEDING AND CURRENT ROW)
AVG(SALES) OVER (ORDER BY SALES_DATE ROWS BETWEEN 7 PRECEDING AND CURRENT ROW)
Answer:
CExplanation:
Calculating a moving average (or rolling average) is a standard time-series analysis technique used to smooth out short-term fluctuations and highlight longer-term trends. In Snowflake, this is accomplished using Window Functions and the ROWS framing clause.
To calculate a 7-day moving average when you have one record per day, the "window" or "frame" must encompass exactly 7 rows. In SQL windowing syntax, the CURRENT ROW counts as one of those days. Therefore, to reach a total of 7, you need to look back at the 6 preceding rows ($6 + 1 = 7$).
Evaluating the Options:
Options A and B use the SUM() function. While the sum is part of an average, the question specifically asks for the average itself.
Option D is incorrect because 7 PRECEDING AND CURRENT ROW actually creates an 8-day window (the current day plus the seven days before it).
Option C is the 100% correct answer. It uses the AVG() aggregate function and correctly defines the frame as 6 PRECEDING AND CURRENT ROW, ensuring the calculation reflects exactly one week of data including the current day.
There are two similarly-structured and sized tables, Table_a and Table_b, in a schema with data populated in both tables. A Data Analyst is running queries as part of a preliminary analysis of the data to check the MAX value of a numeric column named num which is present in both the tables:
Query 1: SELECT MAX(num) FROM Table_a;
Query 2: SELECT MAX(num) FROM Table_b;
After running the queries, the Analyst observed that Query 2 ran significantly slower than Query 1. Why is this occurring?
Options:
Table_b has more rows than Table_a.
Table_b has a row-access policy defined.
A multi-cluster warehouse was used to run Query 1.
The USE_CACHED_RESULT was set to FALSE before running Query 2.
Answer:
BExplanation:
In Snowflake, the performance of a metadata-based query (like MAX, MIN, or COUNT) is typically near-instantaneous because Snowflake maintains constant-time statistics in its Cloud Services layer. For a standard table, SELECT MAX(num) does not even require a virtual warehouse to be active; it simply reads the value from the table's metadata.
However, when a Row Access Policy (RAP) is applied to a table, the query's behavior changes fundamentally. A row access policy is a security feature that restricts which rows are visible to a user based on their role or other attributes. To enforce this policy, Snowflake can no longer rely on the high-level metadata of the entire table because it must first determine which specific rows the user is authorized to see. Consequently, the query engine must scan the individual micro-partitions and evaluate the policy logic for every row (or block of rows) to filter out unauthorized data before calculating the maximum value. This turns a "metadata-only" operation into a data-scanning operation, which requires a running warehouse and significantly more time.
Evaluating the Options:
Option A is incorrect because the prompt states the tables are "similarly-sized." Even if it were slightly larger, a metadata lookup for a standard table would still be nearly instant.
Option C is incorrect because a multi-cluster warehouse helps with concurrency (multiple users), not the raw execution speed of a single simple aggregate query.
Option D is incorrect because USE_CACHED_RESULT refers to the Query Result Cache. While turning it off would prevent a "0ms" response from a previous run, it wouldn't explain a "significant" slowdown compared to a standard metadata fetch.
Option B is the 100% correct answer. The presence of a Row Access Policy forces a full data scan and policy evaluation, which is the most common reason for performance degradation in otherwise simple metadata queries.
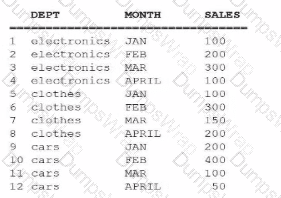
A Data Analyst needs to rotate a table by transforming a wide table’s columns into rows.

Which operator will be MOST beneficial for producing this output?
Options:
PIVOT
UNPIVOT
INTERSECT
EXCEPT
Answer:
BExplanation:
In data modeling and analysis, "rotating" data is a common task used to normalize datasets for reporting or visualization. The operation of taking multiple columns (like the individual months in the source image) and turning them into values within a single column (like the "MONTH" column in the target image) is specifically known as unpivoting.
The UNPIVOT relational operator in Snowflake allows an analyst to transform a "wide" table format into a "narrow" (or "long") table format. In the wide format shown in the first image, data is distributed across columns named JAN, FEB, MAR, and APRIL. While this is often easier for humans to read in a spreadsheet, it is difficult to query for trends. By applying UNPIVOT, Snowflake collapses these columns into two new ones: one for the name of the original column (the attribute, such as "MONTH") and one for the value that was stored in that column (the metric, such as "SALES").
Evaluating the Options:
Option A (PIVOT) is the opposite of the required action. It is used to turn unique values from one column into multiple separate columns (narrow to wide), which is not what is happening in the exhibit.
Option C (INTERSECT) is a set operator that returns only the distinct rows that are present in both the first and second query results. It does not perform data rotation.
Option D (EXCEPT) is a set operator that returns rows from the first query that are not present in the second.
Option B is the 100% correct answer. It is the dedicated relational operator for converting column headers into row values, which is exactly the transformation required to move from the first image to the second. Mastering this operator is a critical skill for any SnowPro Advanced: Data Analyst when preparing messy source data for high-performance analytics.
A Data Analyst executes a query in a Snowflake worksheet that returns the total number of daily sales, and the total amount for each sale. How can the Analyst check the distribution of the total amount, without running the query again?
Options:
Click on the column header in the results and review the histogram.
Go to Chart and select a histogram that includes the two variables.
Go to Chart and select a bar chart that contains the two variables.
Call the WIDTH_BUCKET function.
Answer:
AExplanation:
One of the most powerful features of the Snowsight interface for a Data Analyst is the automatic data profiling provided in the results pane. Snowflake automatically calculates statistics and visual distributions for the result set of any query executed in a worksheet, provided the result set is not excessively large.
When the Analyst views the query results, they can simply click on the column header for the "total amount" column. This action opens a summary pane that displays key descriptive statistics such as the mean, sum, and a histogram showing the frequency distribution of the values in that specific column. This allows for immediate visual analysis of data skew, outliers, or common ranges without requiring the analyst to write additional SQL or move the data to an external visualization tool.
Evaluating the Options:
Option A is the Correct answer. This is the fastest, built-in way to perform "exploratory data analysis" (EDA) on a result set within the UI.
Option B and C are incorrect because while Snowsight does have a "Chart" tab, creating a chart requires manual configuration and is a separate step from the automatic profiling features found in the column headers.
Option D is incorrect because calling the WIDTH_BUCKET function would require the Analyst to run the query again with modified SQL logic, which explicitly contradicts the requirements of the question.
This feature significantly enhances the Data Analysis workflow by providing "at-a-glance" insights into data quality and distribution directly within the development environment.
This query is run:
SQL
SELECT
customer.id,
ANY_VALUE(customer.name),
SUM(orders.value)
FROM customer
JOIN orders ON customer.id = orders.customer_id
GROUP BY customer.id;
What is the effect of ANY_VALUE in this syntax?
Options:
It will return an equivalent NULL value when the expression is evaluated.
It will return some value of the expression from the group, with a non-deterministic result.
It will return the minimum value of those generated by the expression, with a deterministic result.
It will return a value equivalent to the median of those generated by the expression, which may be a non-deterministic result.
Answer:
BExplanation:
The ANY_VALUE function is an aggregate function used in Snowflake to bypass the requirement that all non-aggregated columns in a SELECT list must appear in the GROUP BY clause. In the provided query, the data is grouped by customer.id. Standard SQL would require customer.name to also be in the GROUP BY clause, even if every ID only has one name associated with it.
By using ANY_VALUE(customer.name), the analyst tells Snowflake to simply pick a value from the group. The core characteristic of this function is that it is non-deterministic. This means that if there are multiple different names for a single customer.id, Snowflake does not guarantee which one will be returned; it returns "any" value it finds most efficient to retrieve during processing. In most data modeling scenarios where a 1:1 relationship exists between an ID and a Name, ANY_VALUE is a performance-optimized alternative to using MIN() or MAX(), as it requires less computational overhead to identify a single representative value.
Evaluating the Options:
Option A is incorrect because ANY_VALUE only returns NULL if all values in the group are NULL.
Option C is incorrect because it describes the MIN() function, which is deterministic.
Option D is incorrect as it describes a median calculation (like MEDIAN()), which is a specific mathematical operation, not a "pick any" operation.
Option B is the 100% correct answer. It accurately defines the function's purpose: returning an arbitrary value from the group, acknowledging that the specific result is non-deterministic.
A Data Analyst needs to add address details based on a customer's latitude and longitude to a customer sales database. The Analyst found a free Worldwide Address Data listing on the Snowflake Marketplace. The ACCOUNTADMIN placed the data set into a new database called ADDRESS_DATA. The Data Analyst needs to join the ADDRESS_DATA.OPENADDRESS table with the ORDERS table which is stored in the GLOBAL_DWH database. The combined data set needs to be created as a view. How can this be achieved?
Options:
Create a view in the ADDRESS_DATA database.
Create a view in the GLOBAL_DWH database.
Create a new schema called ENRICHED in the ADDRESS_DATA database and create this view in the ENRICHED schema.
Ask the ACCOUNTADMIN to grant the Data Analyst the IMPORTED_PRIVILEGES on the ADDRESS_DATA database and then create a view in the ADDRESS_DATA database.
Answer:
BExplanation:
This scenario highlights the rules governing Shared Databases and Cross-Database Joins in Snowflake. When a user acquires data from the Snowflake Marketplace, it arrives in their account as a "Shared Database."
A critical restriction of shared databases is that they are read-only. Users (including Data Analysts and even AccountAdmins) cannot create new objects—such as tables, schemas, or views—directly inside a database created from a share. Therefore, Options A, C, and D are architecturally impossible because they all involve trying to write a new view into the ADDRESS_DATA database.
To combine the shared data with internal data (like the ORDERS table in GLOBAL_DWH), the Analyst must create the view in a database where they have CREATE VIEW privileges and that is writeable. Since GLOBAL_DWH is an internal database owned by the organization, it is the appropriate location to host the logic that joins local data with external enrichment data.
Evaluating the Options:
Option A and C are incorrect because you cannot create objects in a database created from a share.
Option D is incorrect because while IMPORTED_PRIVILEGES are necessary to view the data, they do not grant the ability to create objects within the share.
Option B is the 100% correct answer. By creating the view in the GLOBAL_DWH database (or any other local, non-shared database), the Analyst can successfully reference ADDRESS_DATA.OPENADDRESS and GLOBAL_DWH.PUBLIC.ORDERS in a single SQL statement, effectively creating an enriched data layer for the organization.
A Data Analyst runs a query in a Snowflake worksheet, and selects a numeric column from the result grid. What automatically-generated contextual statistic can be visualized?
Options:
A histogram, displayed for all numeric, date, and time columns
A frequency distribution, displayed for all numeric columns
MIN/MAX values for the column
A key distribution
Answer:
AExplanation:
One of the standout features of the Snowsight interface is its ability to perform automatic Data Profiling. When a Data Analyst executes a query, Snowflake doesn't just return a raw grid of data; it analyzes the result set to provide immediate visual insights.
When you click on a column header in the results pane, a summary statistics panel appears. For numeric, date, and time columns, Snowflake automatically generates a histogram (Option A). This histogram provides a visual representation of the data distribution, allowing the analyst to quickly identify patterns, concentrations of values, or significant outliers without writing additional SQL code.
Evaluating the Options:
Option B: While a histogram is a type of frequency distribution, Option A is more accurate because Snowsight also provides these visualizations for date and time types, not just integers/floats.
Option C: While MIN and MAX values are displayed in the summary panel, they are text-based statistics, not the "visualized" contextual statistic (the histogram) emphasized in the question.
Option D: "Key distribution" is not a standard visualization term used in the Snowsight profiling tool.
Option A: Is the 100% correct answer. It highlights the breadth of the profiling tool (covering numbers, dates, and times) and the specific visual element (the histogram) that makes exploratory data analysis significantly faster for a Data Analyst.
What option would allow a Data Analyst to efficiently estimate cardinality on a data set that contains trillions of rows?
Options:
Count(Distinct *)
HLL(*)
SYSTEM$ESTIMATE
Count(Distinct *)/Count(*)
Answer:
BExplanation:
When working with "Big Data" at the scale of trillions of rows, calculating an exact count of unique values using COUNT(DISTINCT column) is extremely resource-intensive. This is because Snowflake must keep track of every unique value encountered to ensure no duplicates are counted, leading to high memory usage and long execution times (often referred to as "spilling to disk").
To solve this, Snowflake provides HyperLogLog (HLL) functions. HLL(*) (or specifically HLL_ACCUMULATE and HLL_ESTIMATE) allows an analyst to estimate the cardinality (the number of unique elements) with a very small, known margin of error (typically around 1%). This is significantly faster and uses far fewer credits than an exact count because it uses a probabilistic algorithm rather than a state-heavy tracking mechanism.
Evaluating the Options:
Option A is technically correct for small datasets but is highly inefficient for trillions of rows, directly contradicting the "efficiently" requirement of the question.
Option C is a distractor; while Snowflake has various SYSTEM$ functions, SYSTEM$ESTIMATE is not a standard function for cardinality.
Option D is a formula that doesn't target cardinality but rather a ratio (density).
Option B is the correct answer. The HLL family of functions is the industry standard within Snowflake for high-performance cardinality estimation on massive datasets.
A Data Analyst created a cost overview dashboard in Snowsight. Management has asked for a system date filter to easily change the time period and refresh the data in all dashboard tiles with a single filter selection.
The system date filter is shown below:
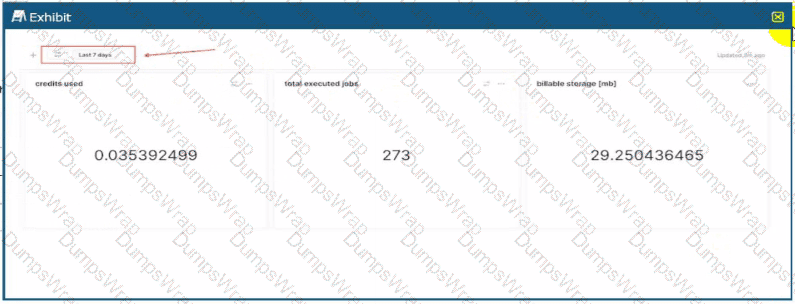
The Analyst wants to apply the filter onto individual dashboard components.
Adding which where clause to the queries will apply the filter as required?
Options:
Where start_time >= dateadd('days', -7, SYSDATE())
Where start_time >= dateadd('days', -7, CURRENT_TIMESTAMP())
Where start_time = :date_filter
Where start_time = :daterange
Answer:
DExplanation:
In Snowsight, the modern web interface for Snowflake, System Filters are specialized keywords that provide out-of-the-box interactivity for dashboards and worksheets. These filters allow non-technical users to manipulate the timeframes of visualizations (e.g., switching from "Last 7 days" to "Last 12 months") without requiring an analyst to manually rewrite the underlying SQL code.
The most critical keyword for temporal filtering is :daterange. When a dashboard contains a date filter widget (as shown in the provided exhibit), the :daterange keyword acts as a dynamic placeholder for the range selected by the user. Unlike a standard variable that might represent a single date, :daterange is specifically designed to handle the start and end boundaries of a period. When injected into a WHERE clause, Snowflake automatically expands this keyword into the appropriate logic to filter records between those two points in time.
Evaluating the Options:
Options A and B are incorrect because they use hard-coded logic (-7 days). While these would return data for the last week, they are static. Changing the filter in the dashboard UI would have no effect on these queries, failing the requirement to "easily change the time period" via the filter selection.
Option C is incorrect because :date_filter is not a reserved system keyword in Snowsight. While an analyst could create a custom filter with that name, it would not automatically link to the standard system date widget shown in the image.
Option D is the 100% correct answer. Using WHERE
What will the following query return?
SELECT * FROM testtable SAMPLE BLOCK (0.012) REPEATABLE (99992);
Options:
A sample of a table in which each block of rows has a 1.2% probability of being included in the sample where repeated elements are allowed.
A sample of a table in which each block of rows has a 0.012% probability of being included in the sample, with the seed set to 99992.
A sample of a table in which each block of rows has a 1.2% probability of being included in the sample, with the seed set to 99992.
A sample containing 99992 records of a table in which each block of rows has a 0.012% probability of being included in the sample.
Answer:
BExplanation:
The SAMPLE clause (or TABLESAMPLE) is used in Snowflake to return a subset of rows from a table. When performing analysis on massive datasets, sampling allows for faster query execution and reduced credit consumption while still providing a statistically representative view of the data.
There are two primary methods of sampling in Snowflake: BERNOULLI (row-based) and BLOCK (partition-based). The query in this question uses BLOCK sampling, which selects a specific percentage of micro-partitions (blocks) rather than individual rows. This method is significantly faster for very large tables because it avoids the overhead of scanning every single row within a block; it either includes the entire block or skips it entirely.
Evaluating the Syntax:
Probability: The value inside the parentheses (0.012) represents the probability percentage for inclusion. Unlike some systems that might use decimals (where 1.0 = 100%), Snowflake treats this number as a direct percentage. Therefore, 0.012 is exactly 0.012%, not 1.2%.
Repeatable/Seed: The REPEATABLE clause (or SEED) followed by a number (99992) ensures that the sampling is deterministic. If the underlying data does not change, running this same query multiple times with the same seed will return the exact same "random" subset of blocks.
Evaluating the Options:
Options A and C are incorrect because they misinterpret the probability 0.012 as 1.2%.
Option D is incorrect because it mistakenly identifies the seed number 99992 as a target row count.
Option B is the 100% correct answer as it accurately identifies the sampling method (BLOCK), the correct percentage probability (0.012%), and the role of the seed (99992).
A Data Analyst is creating a Snowsight dashboard from a shared worksheet. What happens to the access and permissions of the users who initially had sharing privileges on the worksheet?
Options:
The original users retain access and permissions on the worksheet.
The original users gain additional access to the worksheet.
The original users temporarily lose access but regain it once the dashboard is created.
The original users lose access to the worksheet, their permissions on the worksheet are revoked.
Answer:
DExplanation:
When working within the Snowsight interface, the transition from a standalone worksheet to a dashboard component involves a change in how the underlying SQL and its associated metadata are managed. When a worksheet is converted or used to create a dashboard, the ownership and sharing model shifts to the dashboard level.
According to Snowflake's documentation on Snowsight collaboration, when a user creates a dashboard from a worksheet that was previously shared with others, the original worksheet's individual share settings are essentially superseded by the dashboard's own permissions. In many workflow scenarios within the UI, once the worksheet is finalized into a dashboard tile, the direct, independent access to that specific worksheet is severed for the original "sharees." Their permissions on that specific worksheet are revoked to prevent conflicting edits between the standalone version and the dashboard-integrated version.
Evaluating the Options:
Option A is incorrect because Snowsight manages the lifecycle of worksheets used in dashboards as part of the dashboard object; independent sharing of the underlying worksheet is typically disabled or revoked.
Option B and C are distractors; there is no mechanism in Snowsight that grants "additional" access or "temporary" loss during the creation process.
Option D is the 100% correct answer based on the SnowPro Data Analyst standard regarding Snowsight object ownership and sharing lifecycle. To allow others to see the work, the Analyst must now share the Dashboard itself, rather than relying on the previous worksheet-level permissions. This ensures a "single source of truth" for the visualization's logic.
