WGU Applied Algebra FXO2 PFXP C957 Questions and Answers
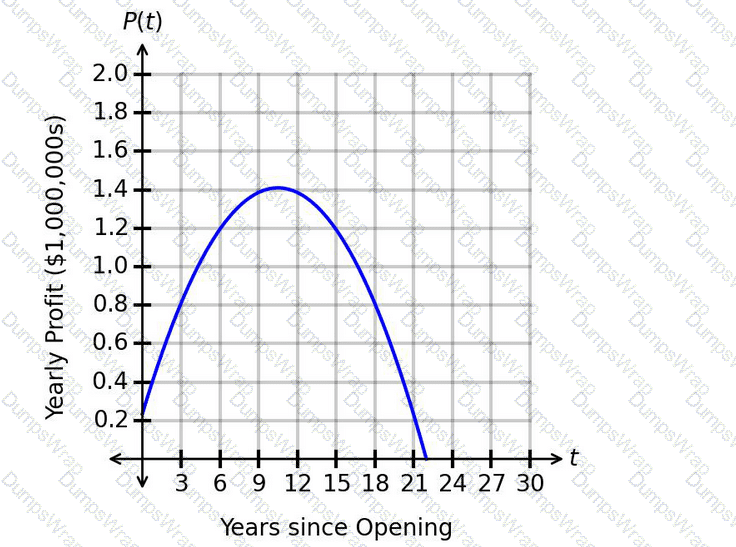
The function P(t) represents the yearly profit, in thousands of dollars, for a virtual store since opening. The graph of P(t) is shown.
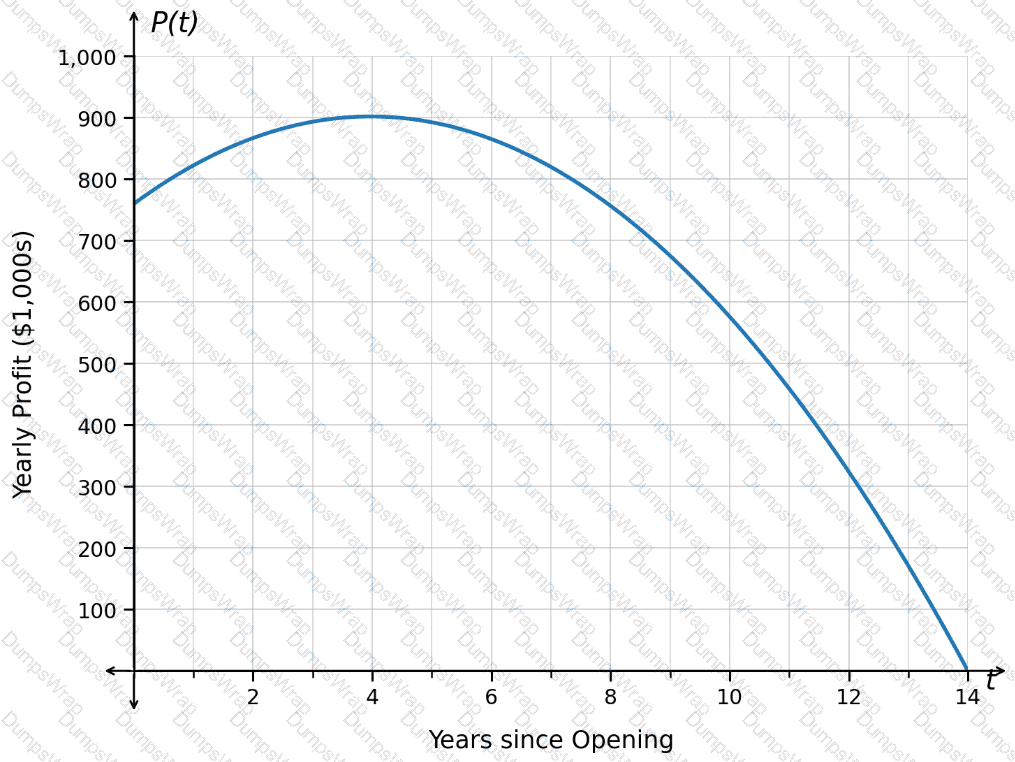
What is the time at which the store reached the maximum yearly profit?
The graphed function n(t)represents the number of animals, n, at a feeding station thours after 5:00 a.m. The plotted points Aand Bhave coordinates (1│10.6)and (8│6.59).
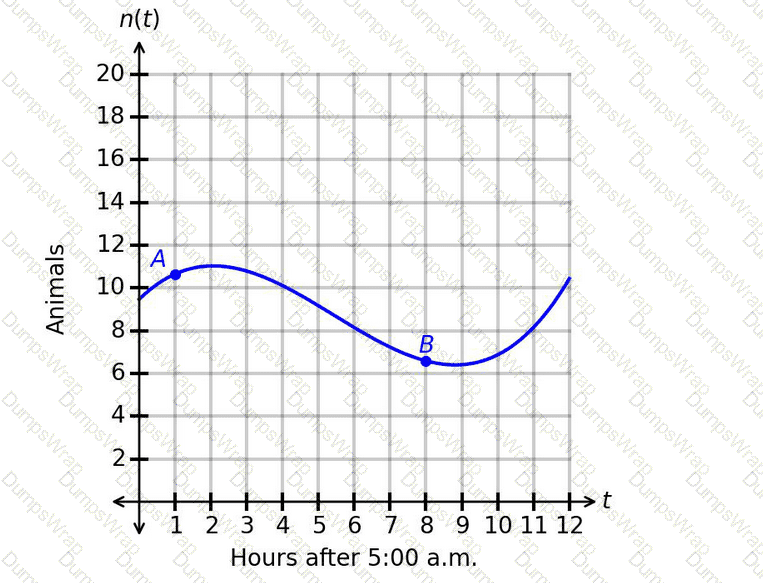
Which statement gives the correct interpretation of the average rate of change of the number of animals over the interval from point Ato point B?
The number of comments on a social media post is represented by the logistic function f(x), whose graph is shown, where xrepresents the number of days since the post was created and f(x)represents the number of comments on day x.
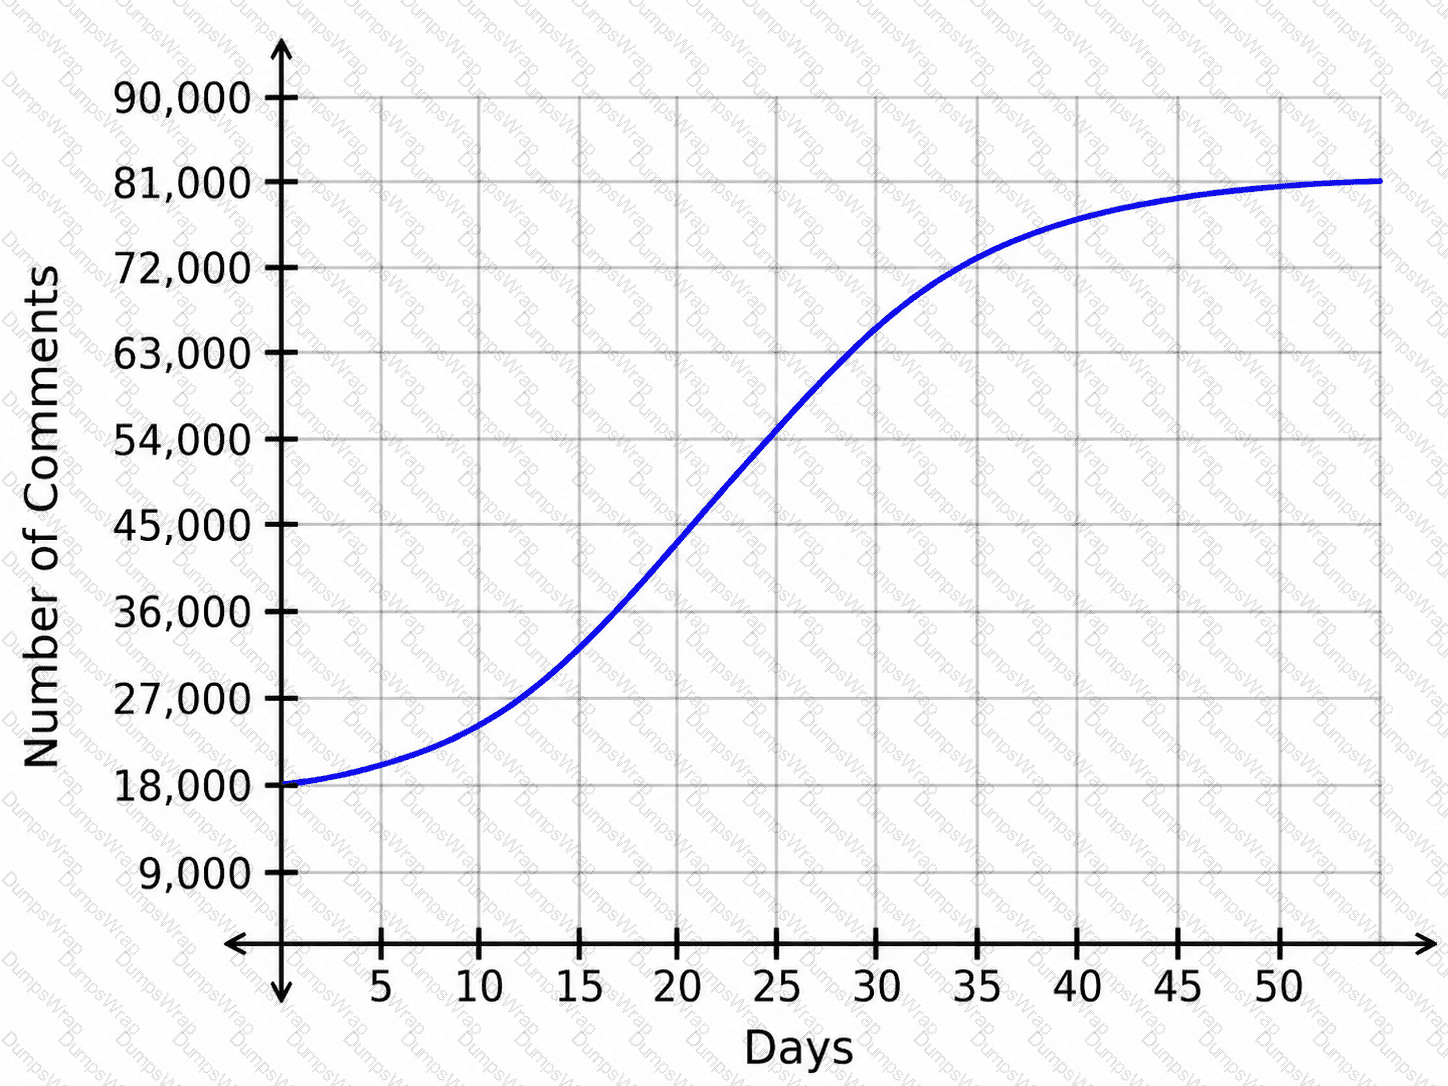
How does the number of comments change as time progresses from day 1 to day 17?
A researcher collected data on the number of annual bear sightings in a region over time. The results are shown in the scatterplot. The graphed regression function has an r
2
value of 0.41. The predicted number of annual bear sightings after 19.4 years is 88.5.
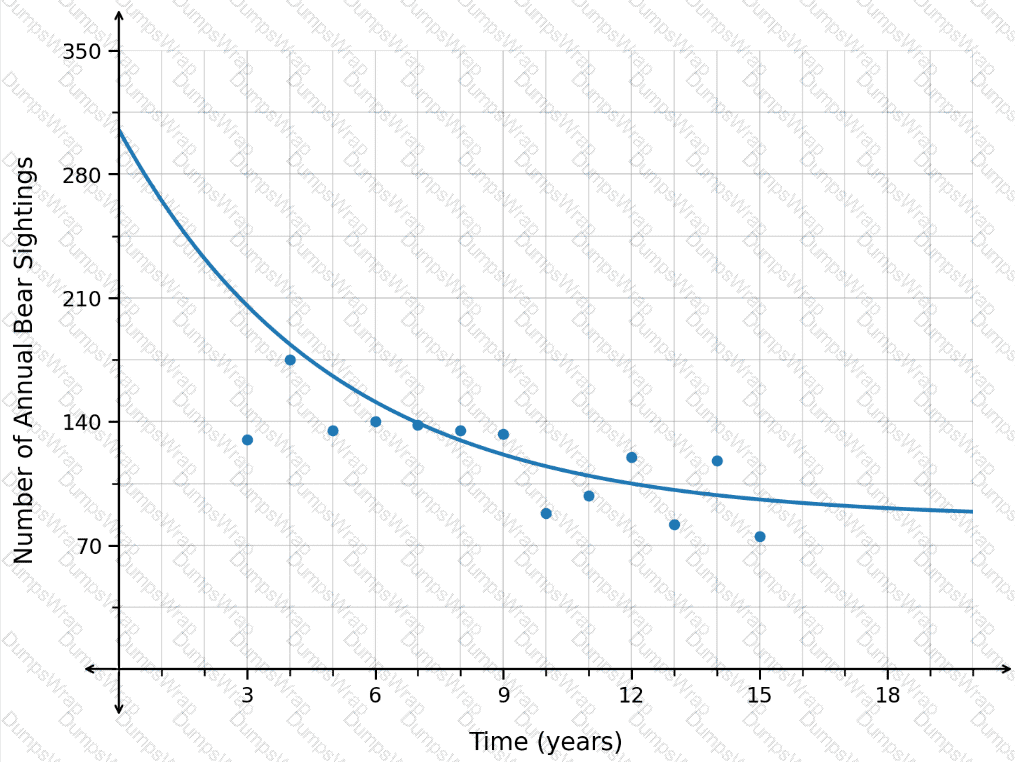
Is this prediction appropriate?
Consider the graph of x(t) shown. The function represents the number of users, x, watching a live video t hours after 9:00 a.m.
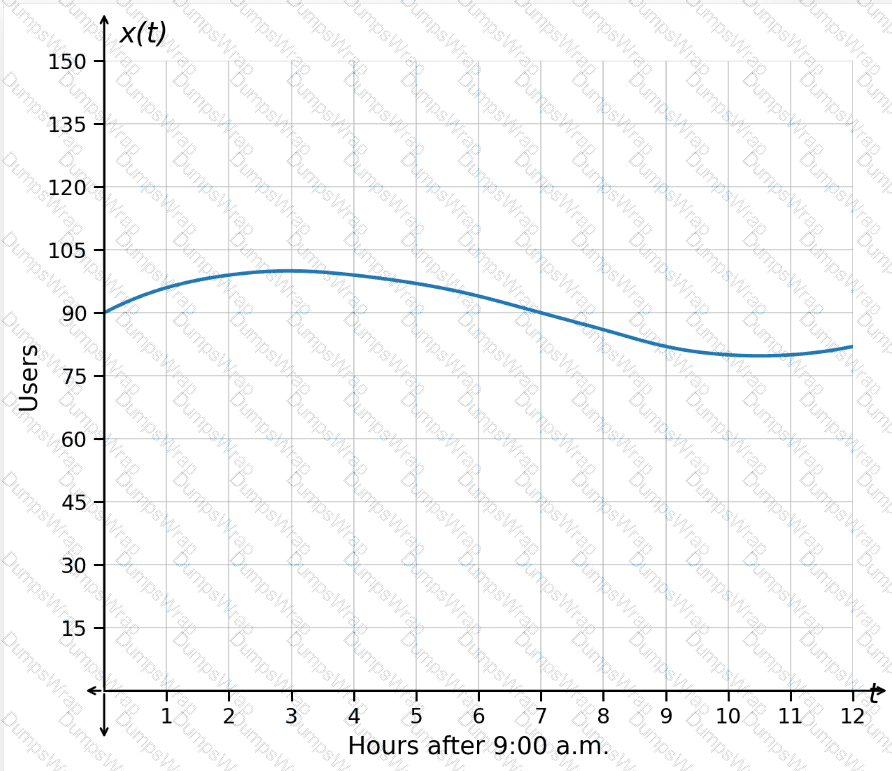
Which interval represents a range of values for which the number of users is decreasing slower and slower?
Through a local marketplace, a person makes livestock feeders to sell. The graph shows the functions modeling the cost and revenue.
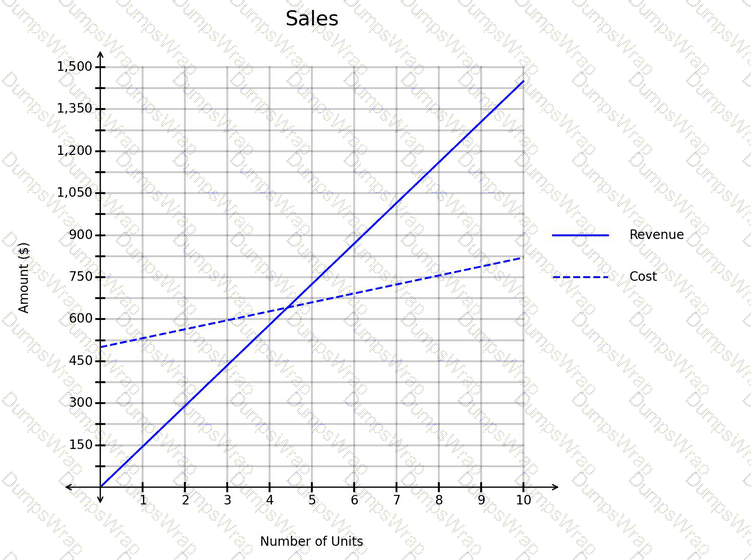
What is the minimum number of livestock feeders that must be sold in order for the revenue to cover the costs?
A factory mixes two colors, red and yellow, to create a dye.
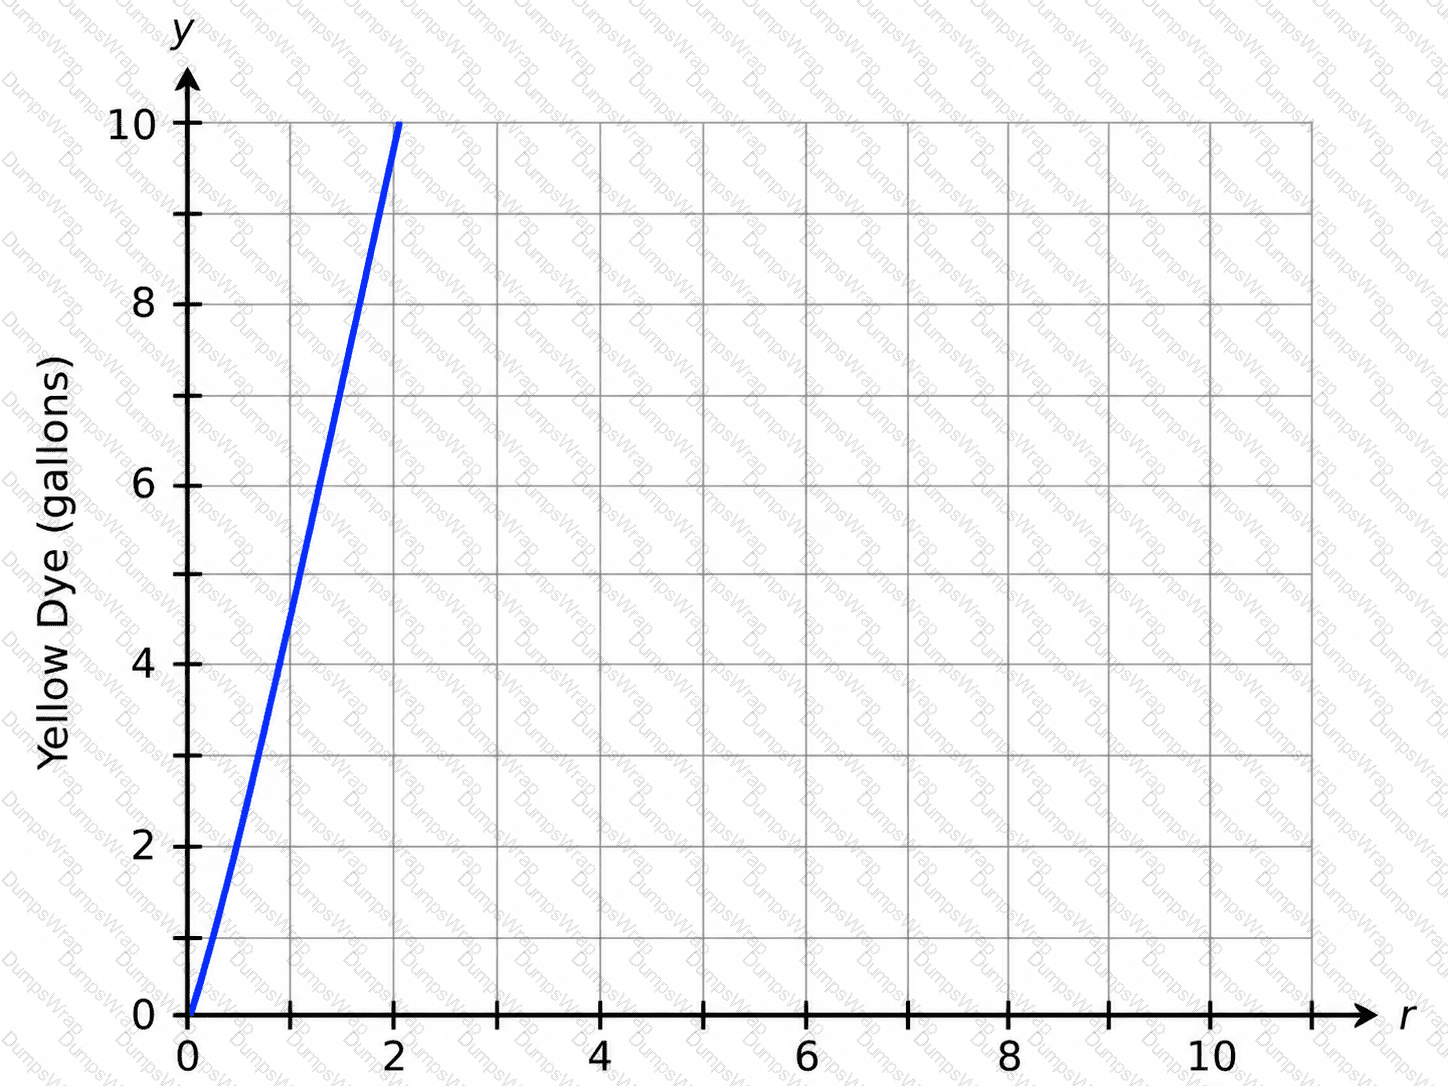
The graph shows the relationship between the amounts of each dye, where rrepresents the amount of red dye and yrepresents the amount of yellow dye.
What is the correct interpretation of the rate of change?
The spread of two viruses within a single population is modeled using the functions in the graph.
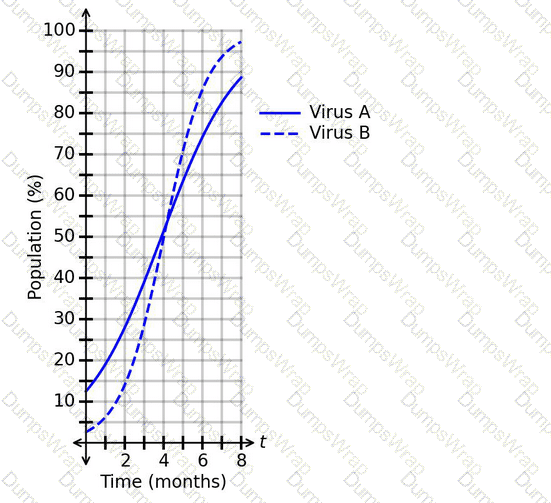
What is a correct conclusion based on the graph?
Based on collected data, the number of employees at a firm can be modeled using the function
f(x)=10× 〖 1.09 〗 ^x
whose graph is shown, where xrepresents the number of years since 2001 and f(x)represents the number of employees, in thousands.
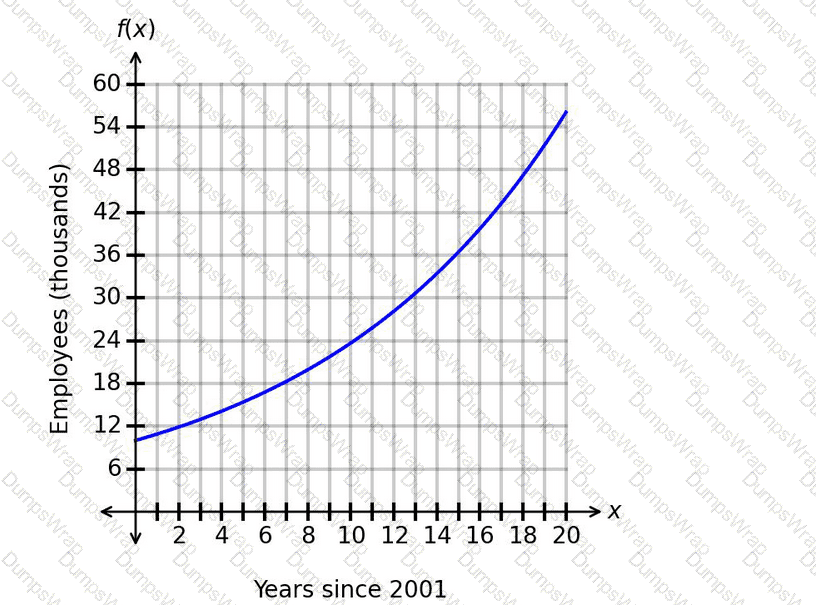
Which time period has the fastest average increase in the number of employees?
The function f(z) represents the relationship between the number of units in two inventories, where z is the number of units in inventory A and f(z) is the number of units in inventory B. The number of units in inventory B is 2 more than the number of units in inventory A. Which function represents this situation?
The function p(t)represents the number of active players, p, in a game thours after 11:00 a.m. The graph of p(t)is shown.
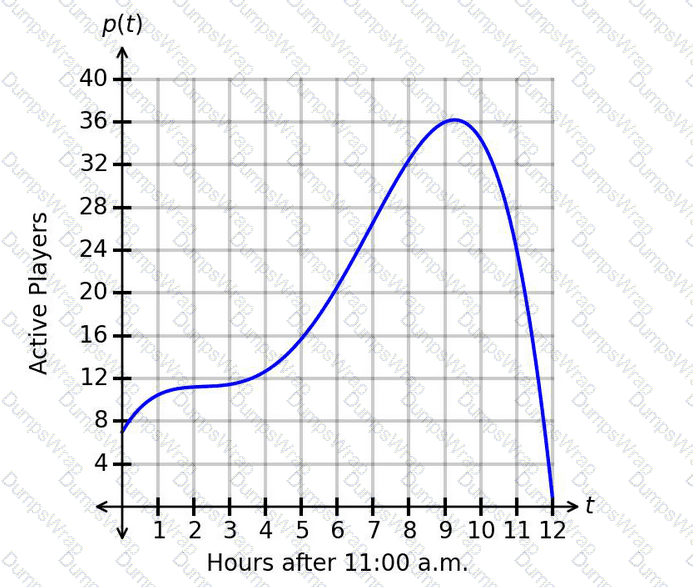
What is one example of an interval for which the number of players is decreasing faster and faster?
The number of letters processed daily at a mail center is modeled by the decreasing exponential function shown in the graph.
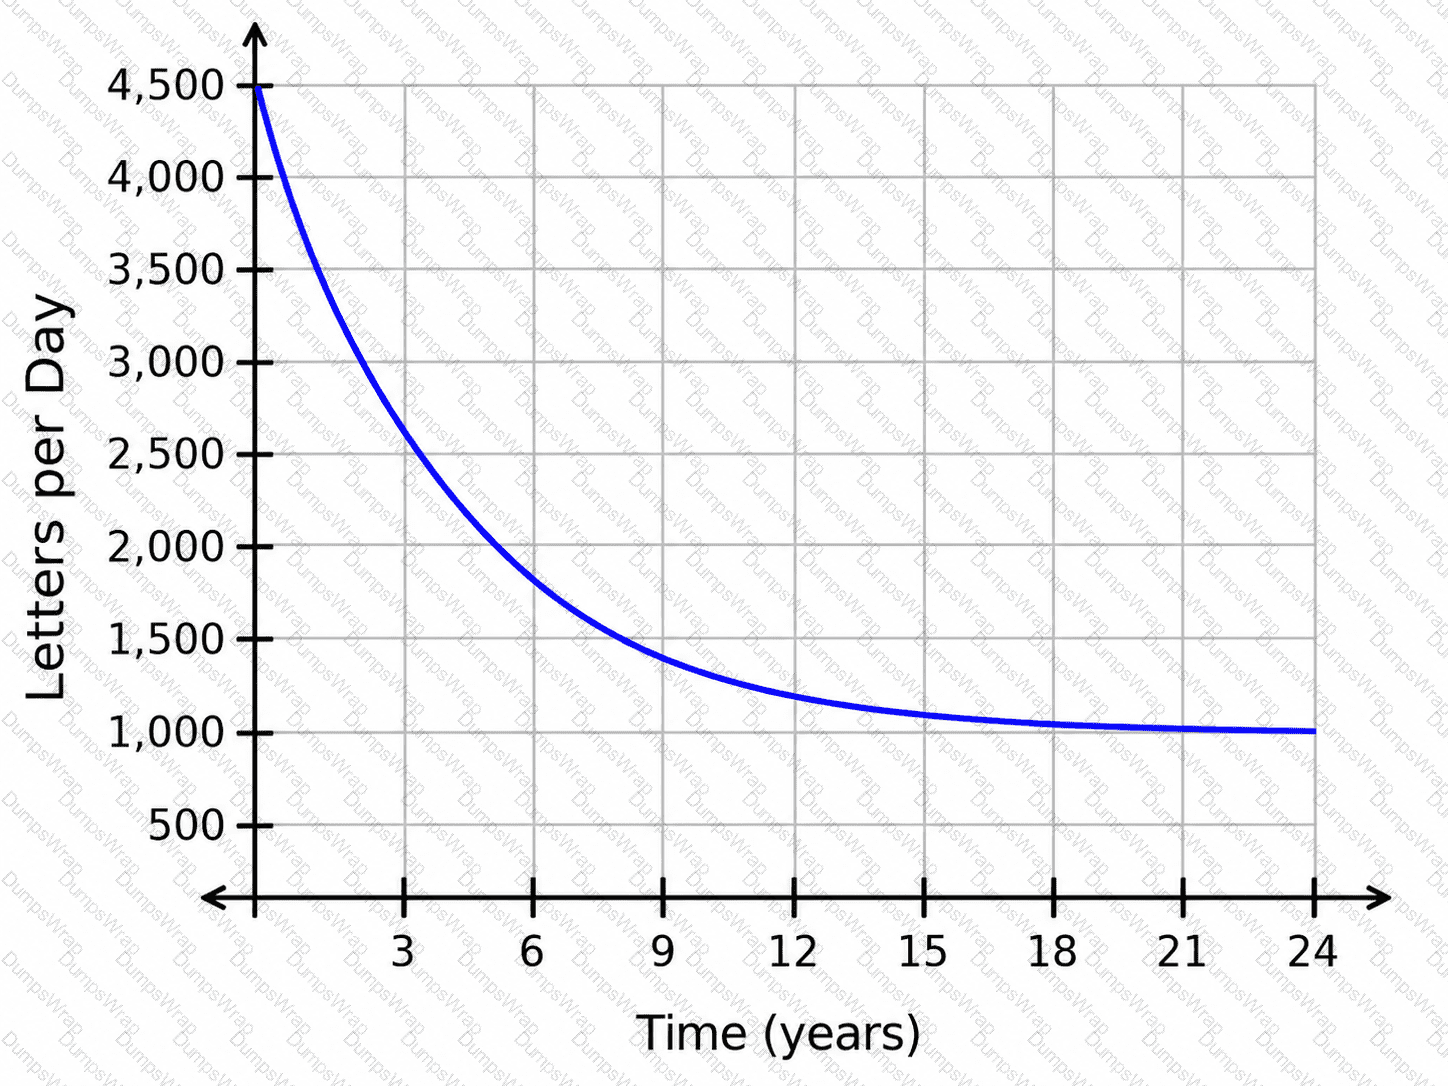
What is the long-term trend in the number of letters processed per day, based on the equation of the horizontal asymptote?
Consider the graph of p(t)shown. The function represents the number of active players, p, in a game thours after 11:00 a.m.
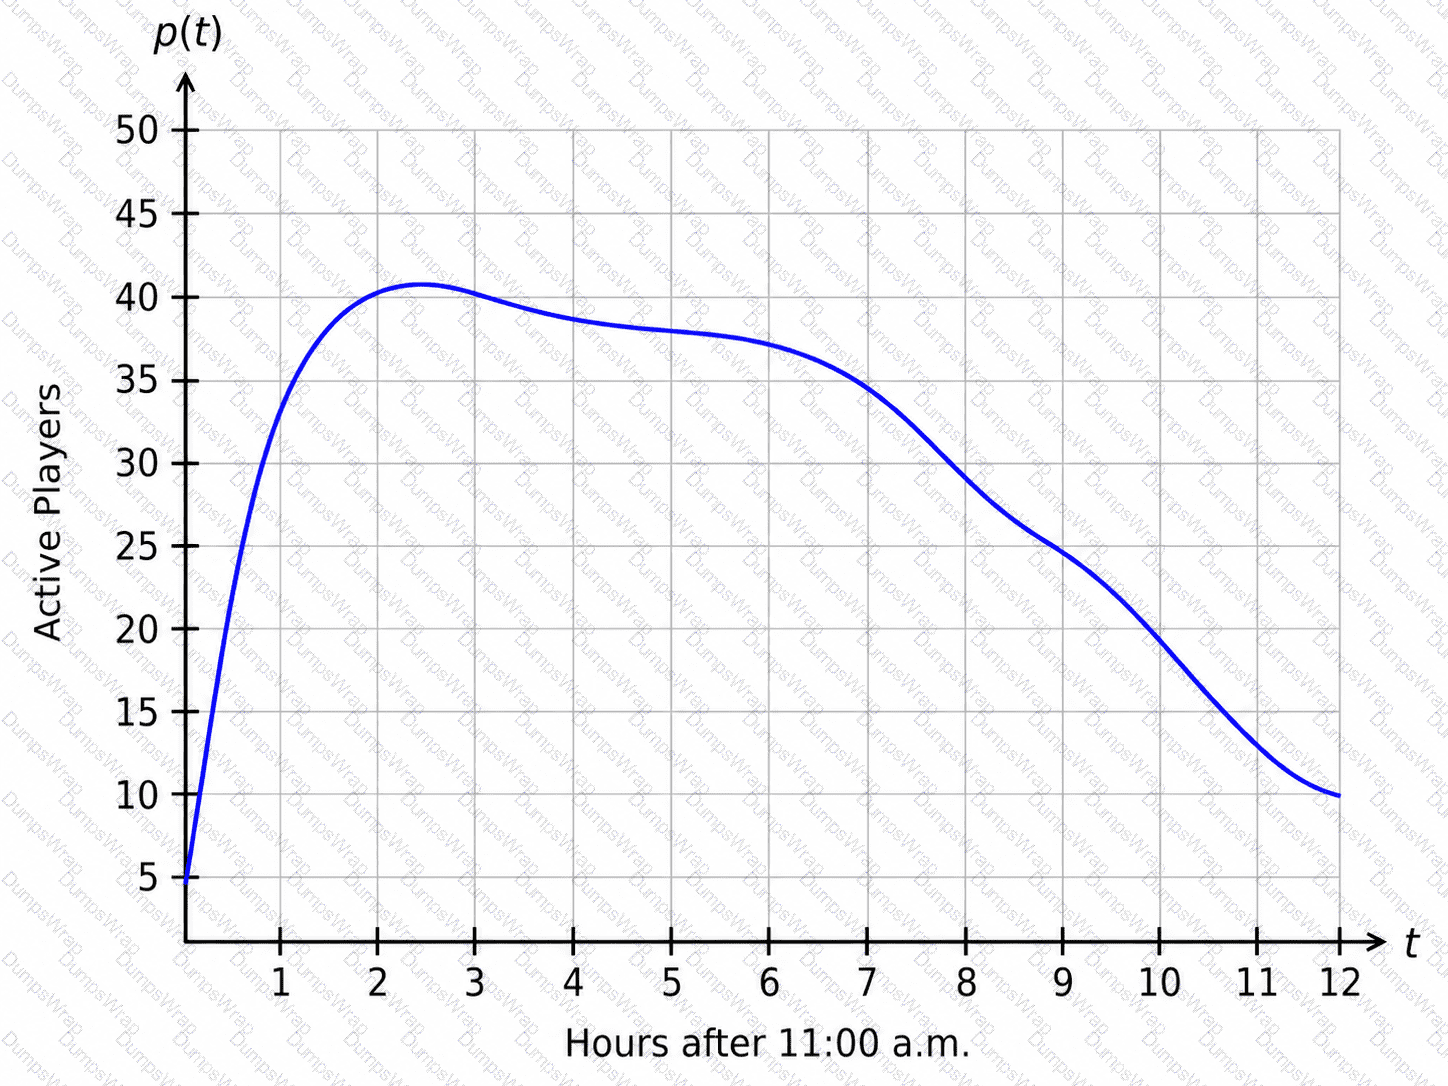
Which interpretation of the concavity between t=0.4and t=3.6is correct?
The number of daily raffle tickets sold, R(d), for a fundraiser is represented by the graph, with the number of days since the beginning of the month along the horizontal axis and the number of raffle tickets sold for the day along the vertical axis.
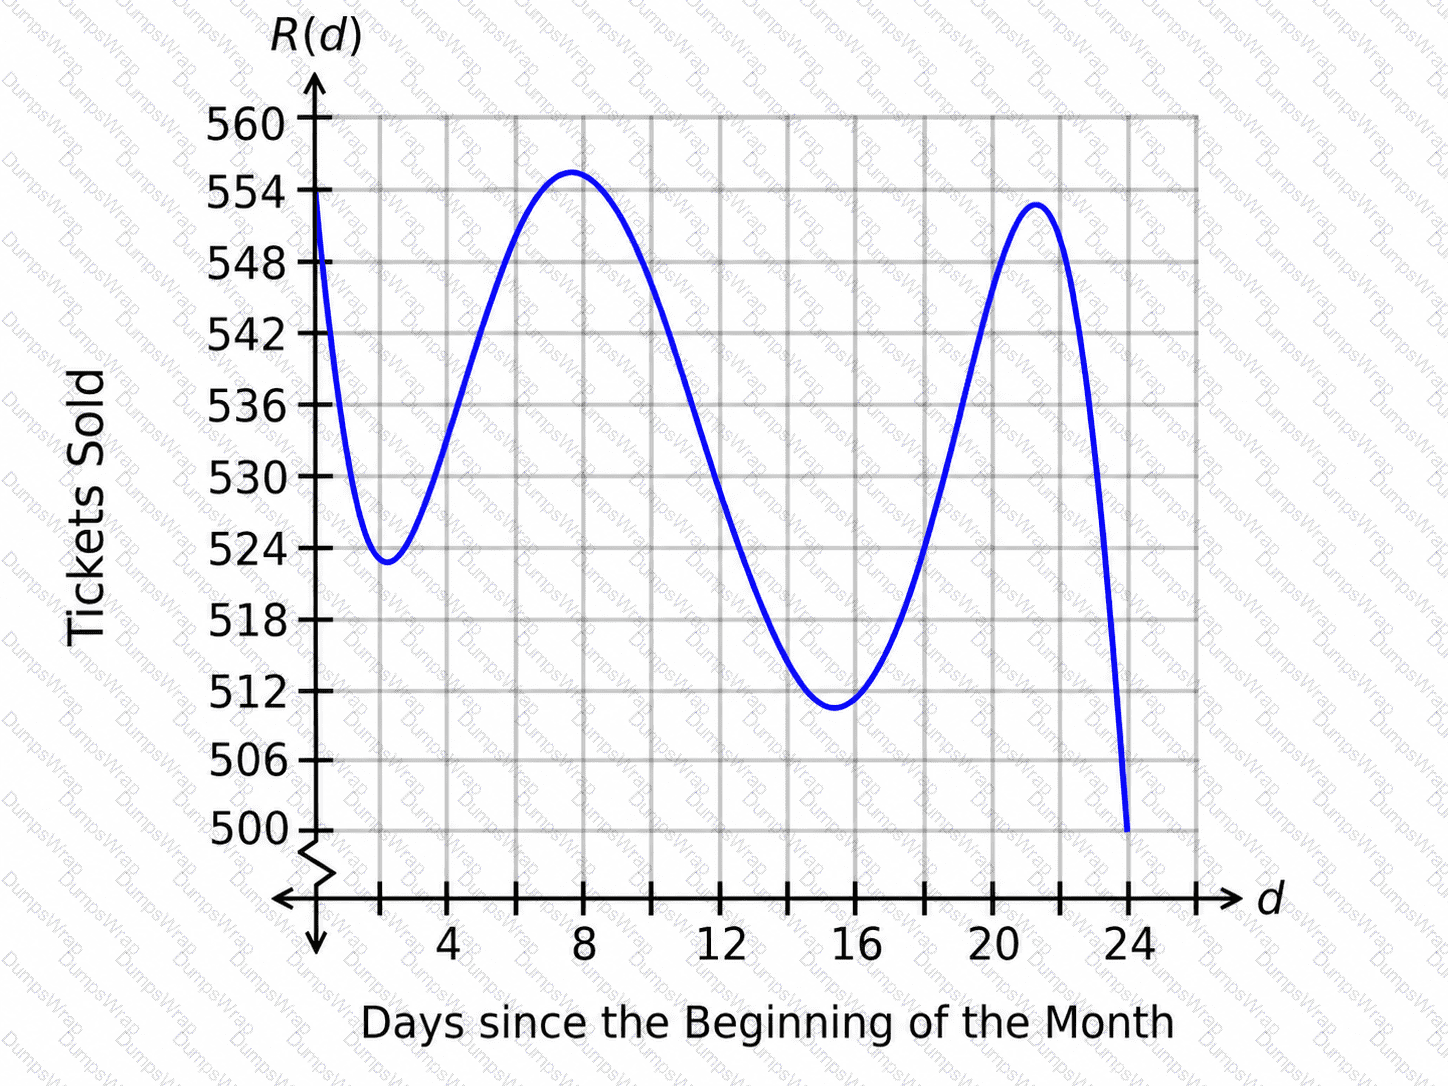
How can the concavity be described from d=0to d=4.4?
The number of property sales in a region this year is expected to be 6 less than the number of property sales in the region last year. The function H(x)represents the number of property sales this year, where xrepresents the number of properties sold last year.
Which notation represents the number of property sales this year, given that the number of properties sold last year was 330?
The function P(t)represents the yearly profit, in millions of dollars, for a streaming service since opening. The graph of P(t)is shown.
What is the correct interpretation of the maximum value?
A researcher collected data on the average selling price for tickets to a concert over time. The results are shown in the scatterplot. A regression function is graphed with r
2
=0.56. The predicted average selling price for tickets after 10.8 days is $167.20.
Is this prediction appropriate?
After a water tank starts leaking, the amount of water in the tank is modeled by the exponential function that is graphed.
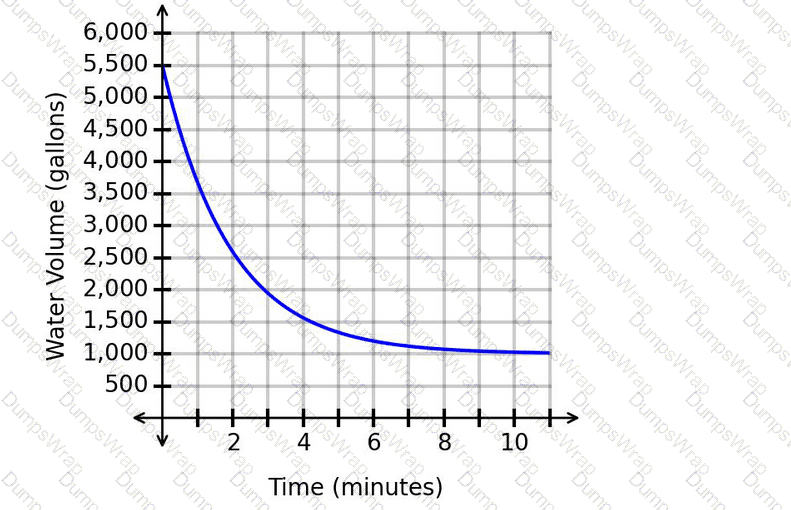
Which statement is justified considering the location of the horizontal asymptote?
A researcher collected data on the number of books donated per month to a thrift store over time. The results are shown in the scatterplot. A regression function is graphed with r
2
=0.99.
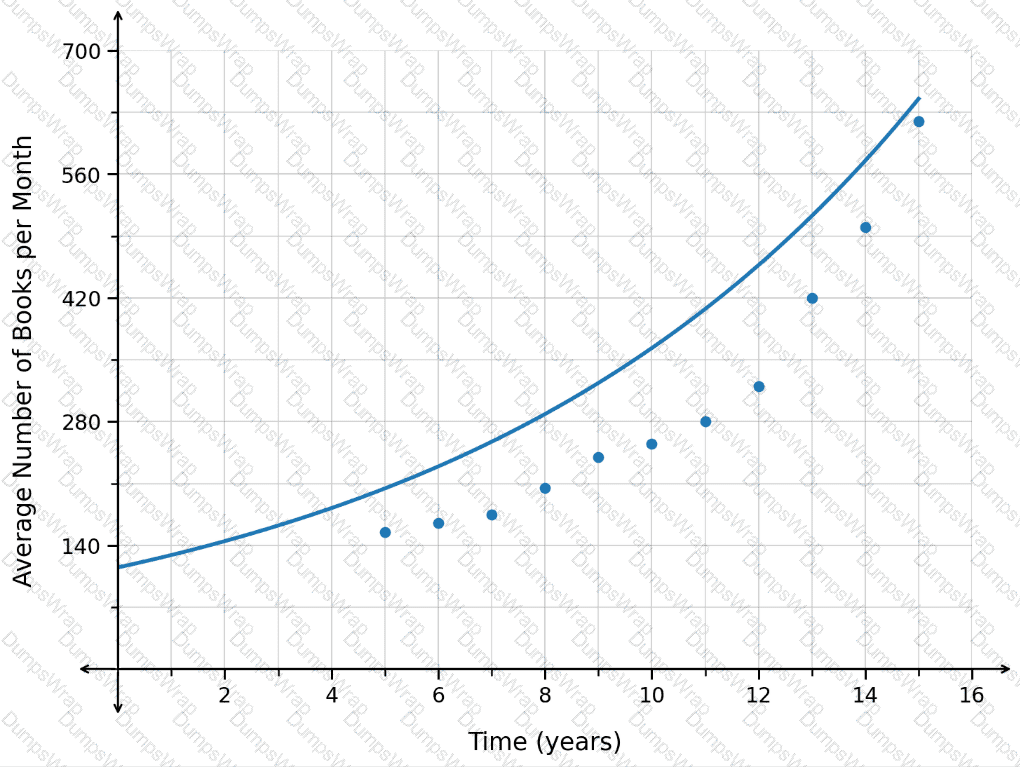
Which range of x-values is appropriate for extrapolation?
The temperature of an object changes according to the relationship in the graph.
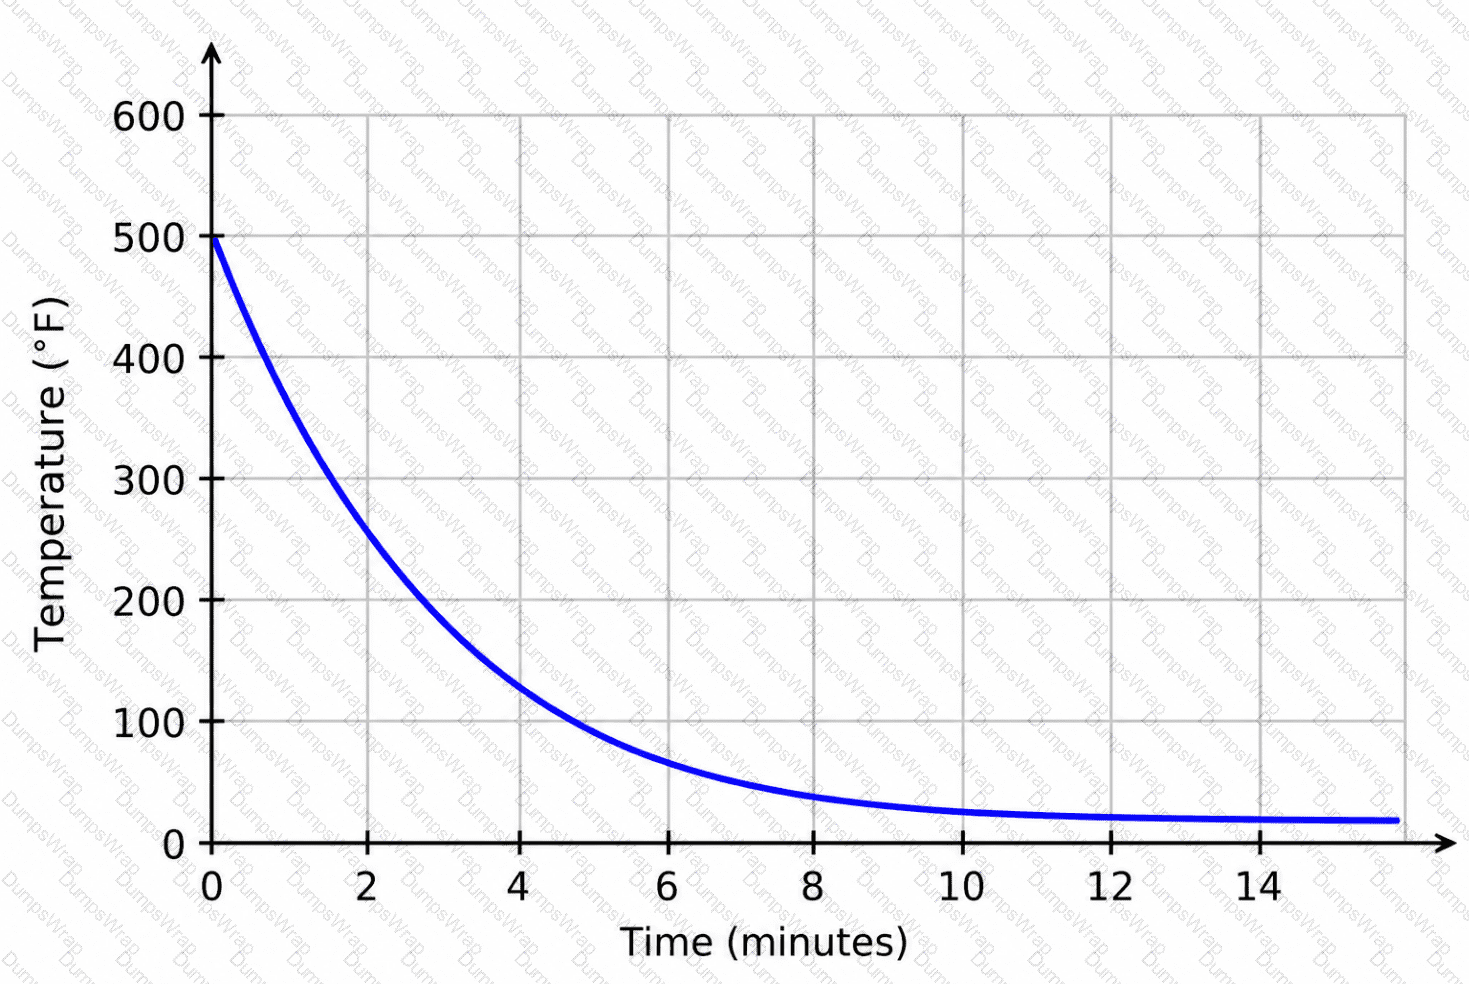
Which equation represents the horizontal asymptote of the function?
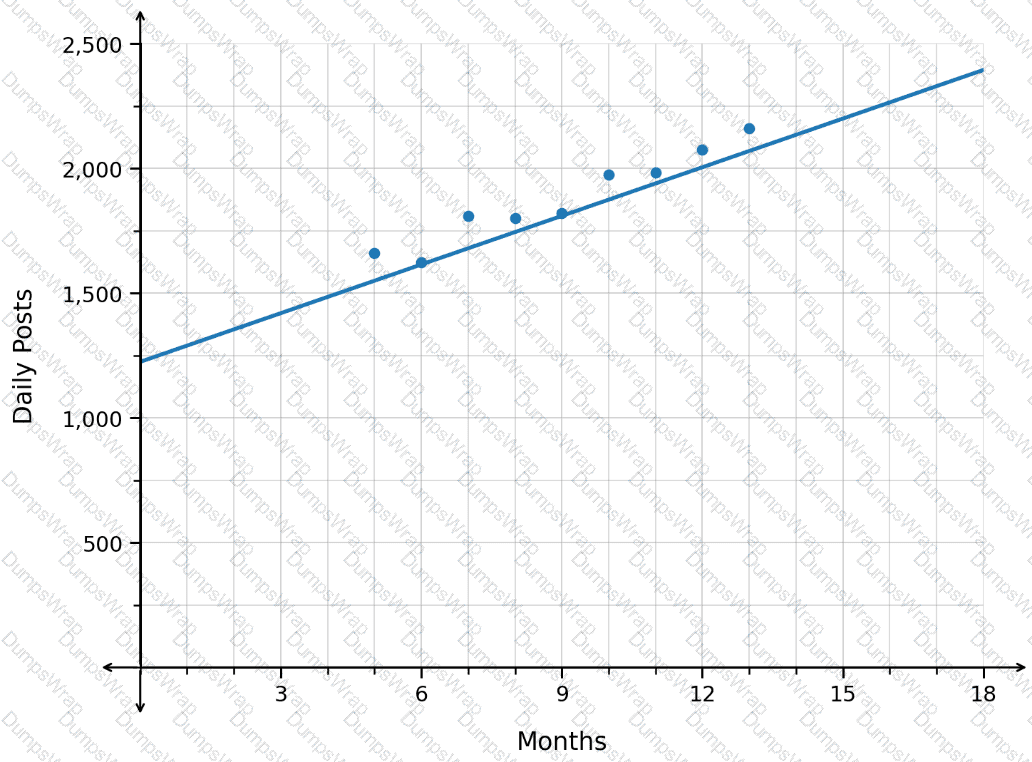
The data in the scatterplot represents the number of monthly train crossings at a particular intersection over time.
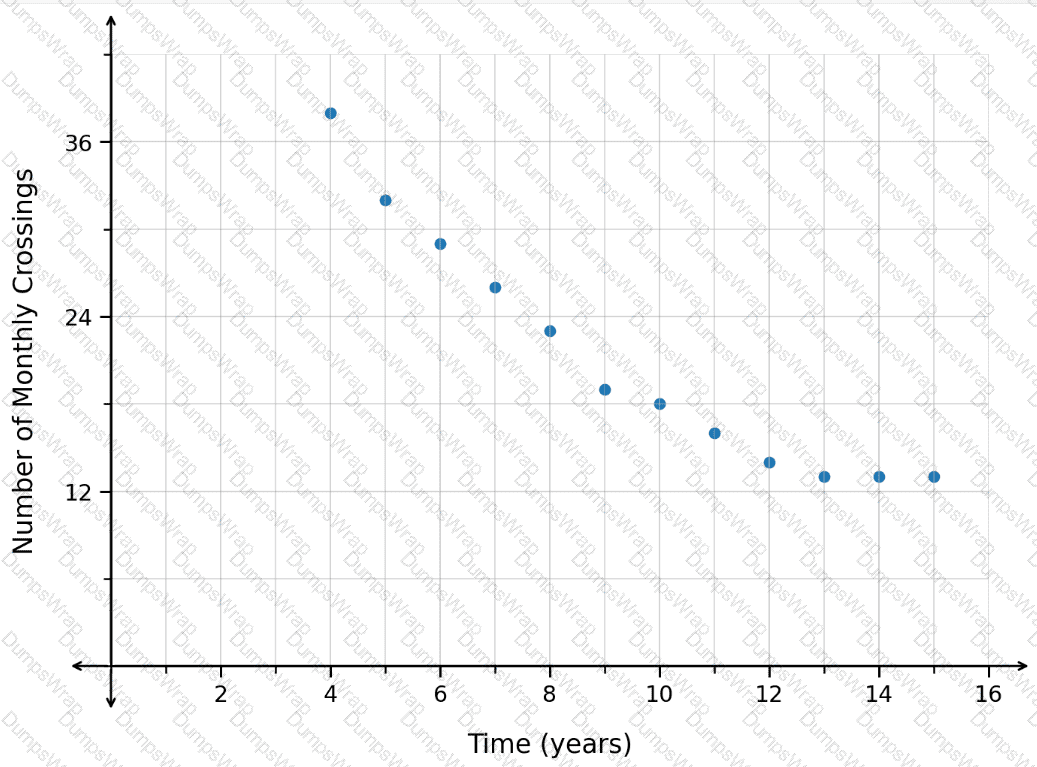
Which type of function should be used to model the data?
The spread of two viruses within a single population is modeled using the functions in the graph.
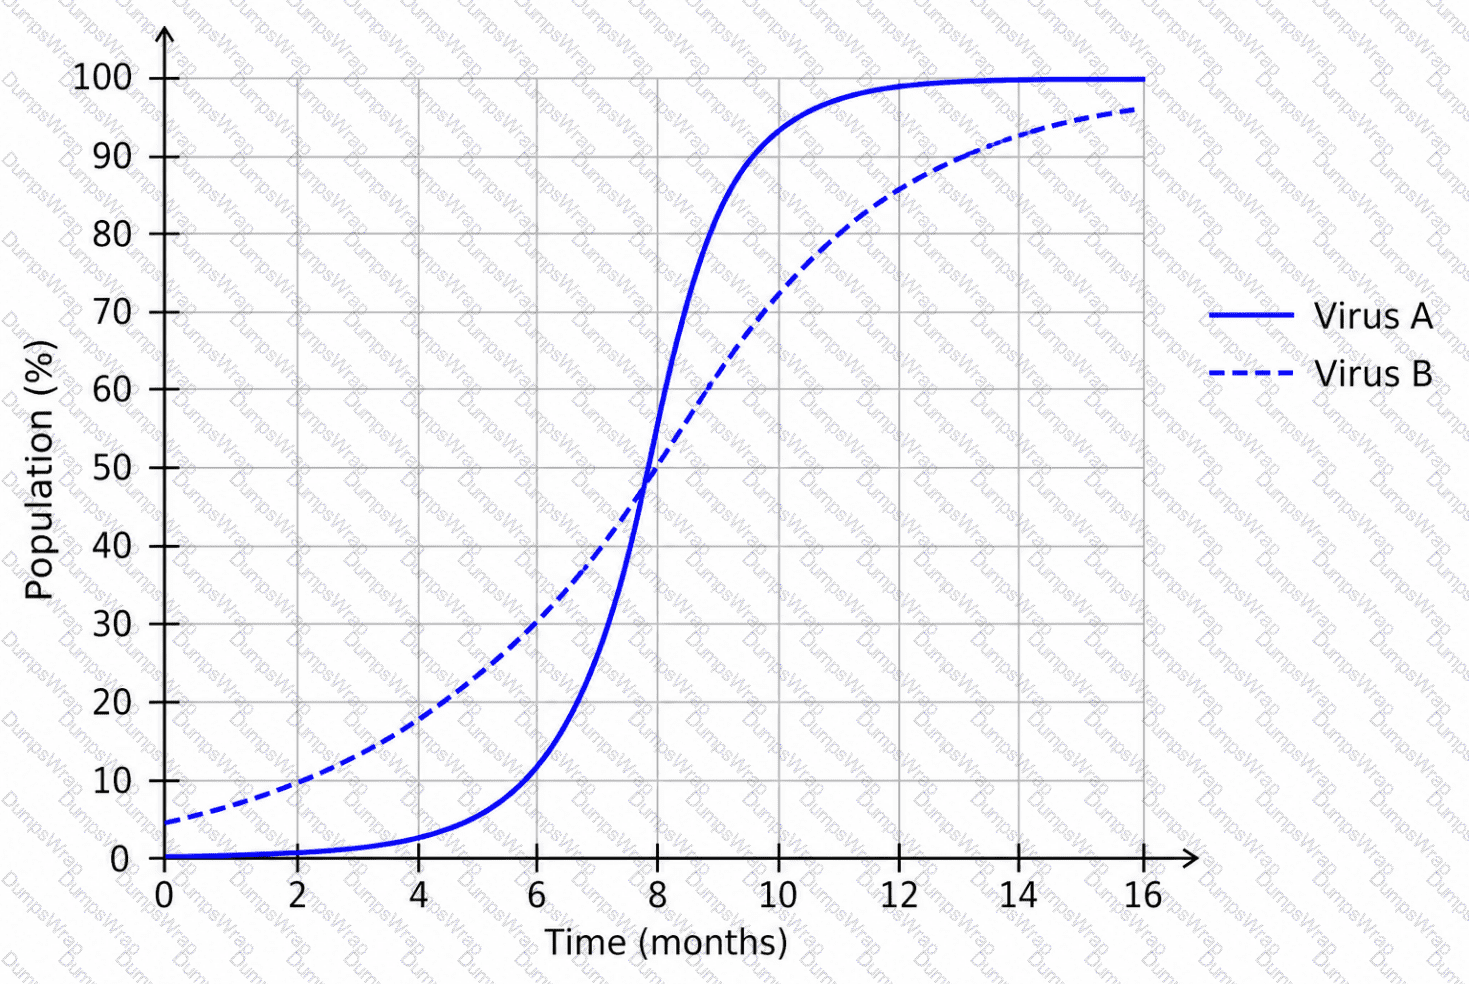
What is a correct conclusion based on the graph?
A researcher collected data on the number of annual bear sightings in a region over time. The results are shown in the scatterplot. A regression function is graphed with r^2=0.42. The predicted number of annual bear sightings after 19.5years is 62.2.
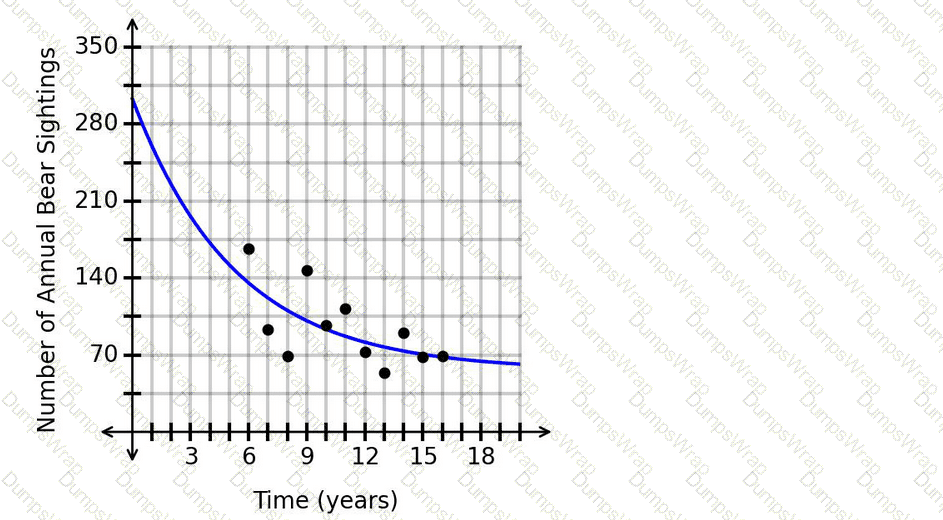
Is this prediction appropriate?
In the following graph showing the elevation profile, F(d), for a mountain biking course, the horizontal axis shows the number of miles since the start of the course and the vertical axis shows the elevation in feet.
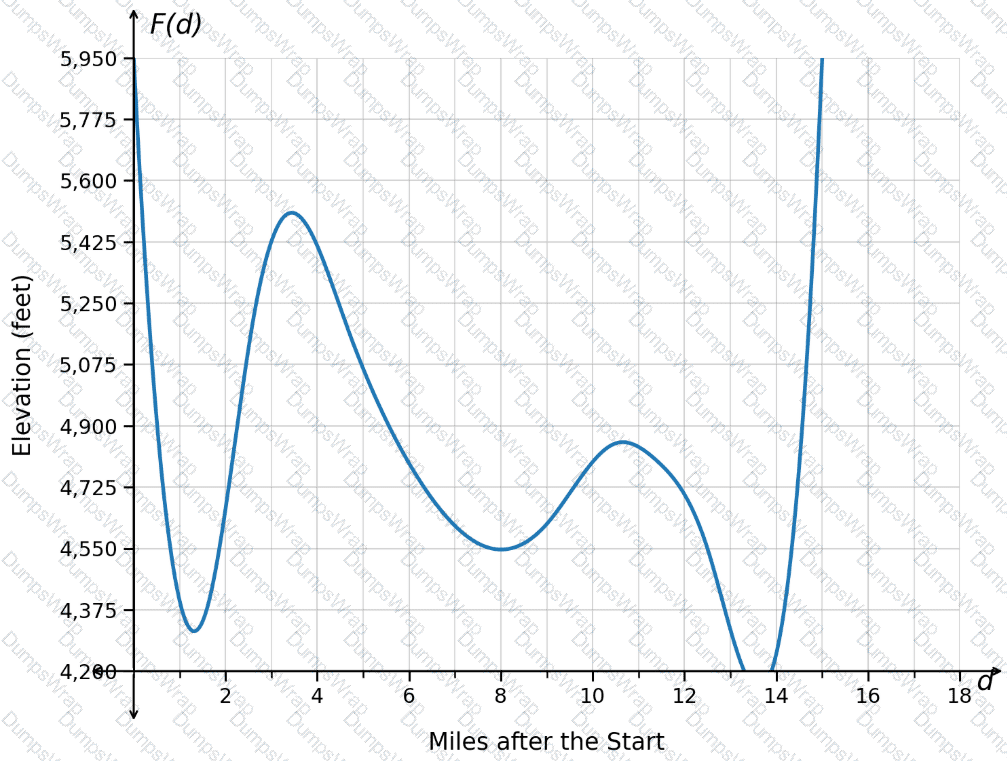
How can the concavity be described from d=10 to d=13.1?
The value of a collectible coin can be modeled by F(t), where t represents years since the number of years since the coin was found, and the vertical axis represents the value, in thousands of dollars.
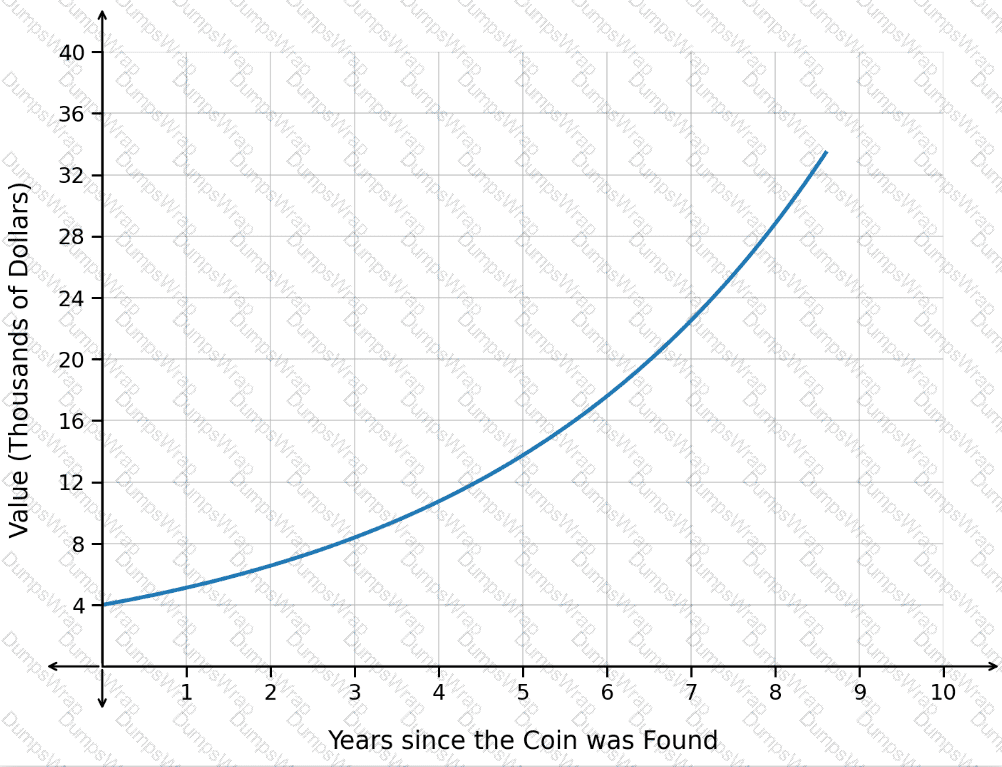
How is the value of the coin changing over time based on the graph?
The value of a painting is represented by the function
f(x)=330× 〖 1.04 〗 ^x
In this function, xrepresents the number of years since 2004, and f(x)represents the value of the painting in dollars.
Which value represents the average yearly rate of change of the painting ' s value from 2013 to 2018?
The function N(t)models the number of subscribers to a virtual newsletter over time. The graph of N(t)is shown. The horizontal axis represents the number of years since the newsletter started, and the vertical axis represents the number of subscribers, in thousands.
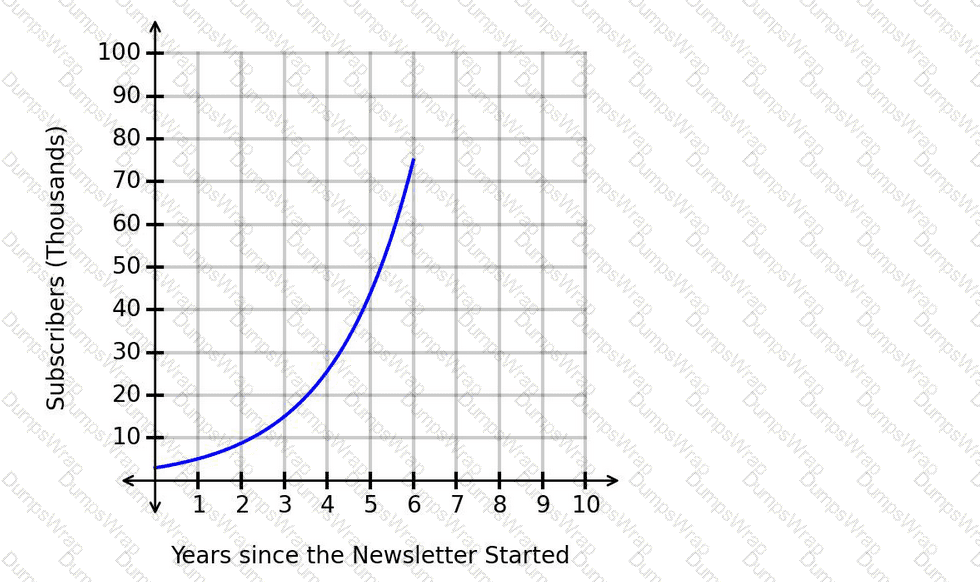
How is the number of subscribers changing over time based on the graph?
As sacks are unloaded off a wagon, the total weight of the wagon and sacks changes. Each sack has the same weight. After 5 sacks are removed, the total weight of the wagon and remaining sacks is 135 pounds. After 9 sacks are removed, the total weight is 87 pounds. What is the weight of each sack?
An investment account accrues interest every year, and the value of the account is given by G(x). The graph of this function is shown.
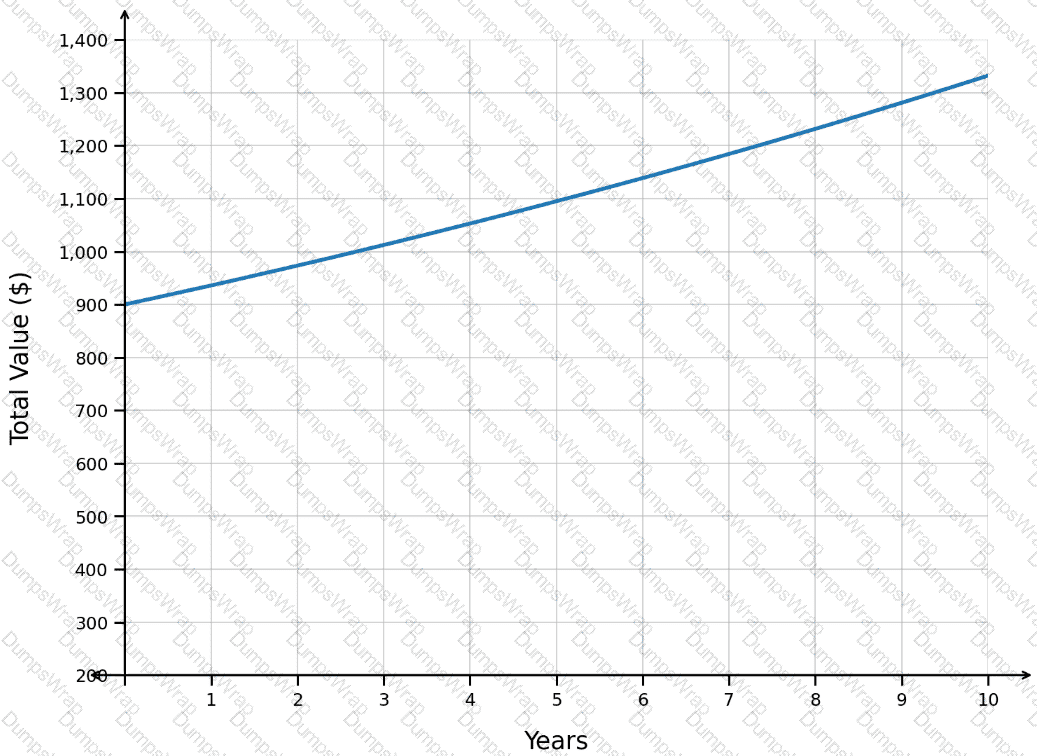
What represents the value of the account after 4 years?
Based on collected data, the value of a painting can be modeled using the exponential function f(x)=240(1.12)
x
. In this case, x represents the number of years since 2005, and f(x) represents the value of the painting in dollars.
Which value represents the average yearly rate of change of the painting’s value from 2013 to 2015?
The scatterplot shows data on the usage of a computer ' s CPU over time. The graphed regression function has an r^2value of 0.25.
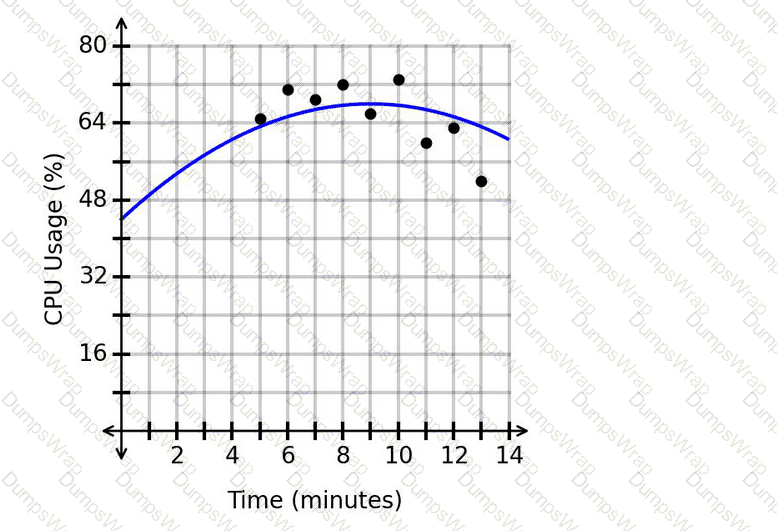
What is the appropriate range of x-values for extrapolation?
A vehicle is travelling away from a rest stop. The function
D(t)=48t+23
represents the distance from the vehicle to the rest stop at time t, where t is measured in hours and D is measured in miles.
What is the value of D(1.7)?
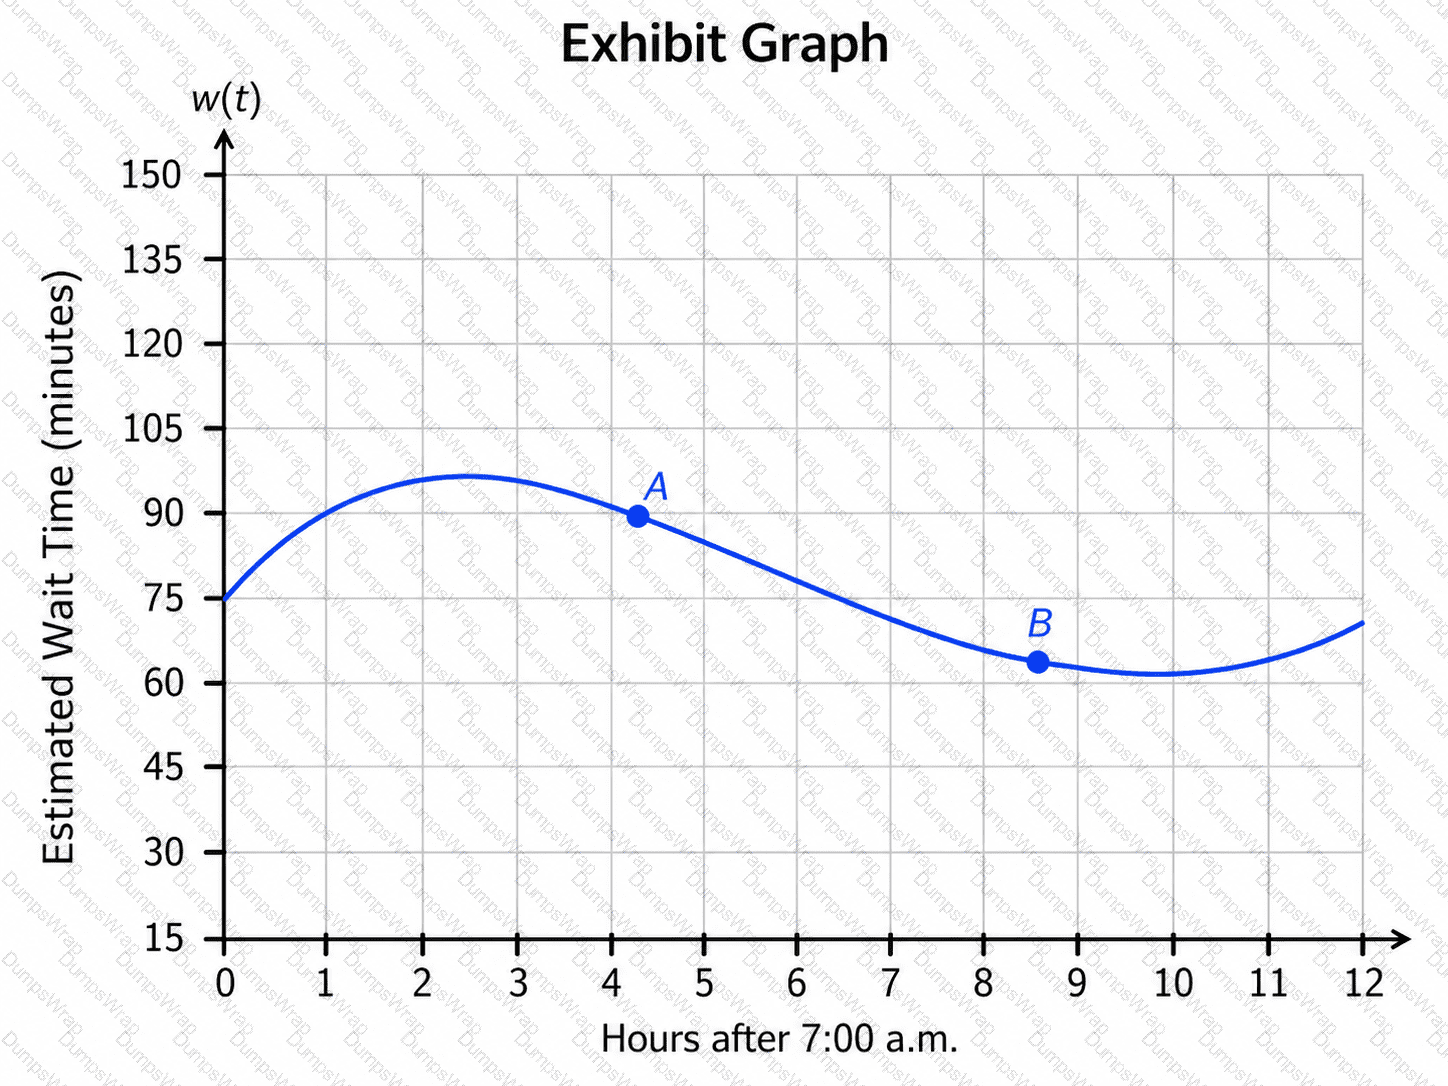
The graph shows the estimated wait time, in minutes, based on the number of hours after 7:00 a.m.
What is the average rate of change of the wait time from point Ato point B?
The graph shows the estimated wait time, in minutes, based on the number of hours after 7:00 a.m.
What is the average rate of change of the wait time from point Ato point B?
The temperature of an object changes according to the relationship in the graph.
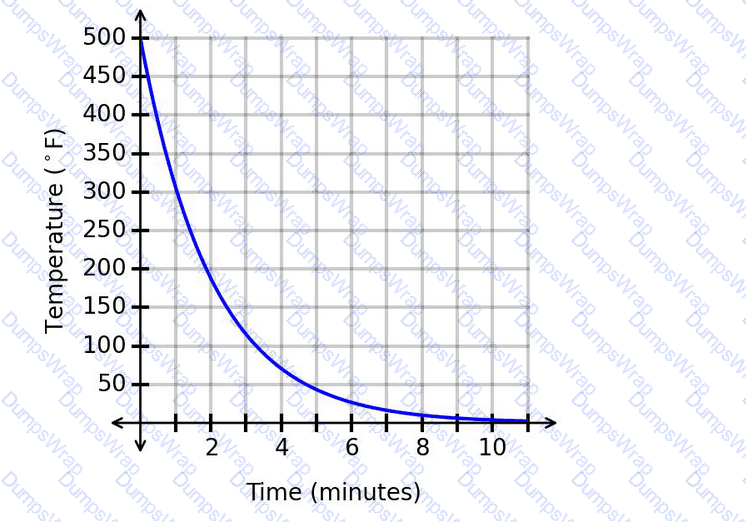
What is the equation of the horizontal asymptote?
As sacks are unloaded off a wagon, the total weight of the wagon and sacks changes. Each sack has the same weight. After 3 sacks are removed, the total weight of the cart and remaining sacks is 116 pounds. After 6 sacks are removed, the total weight is 101 pounds.
What is the weight of each sack?
The number of registered voters in a district is modeled by a decreasing exponential function, where x represents the number of years since 2005 and f(x) represents the number of registered voters.
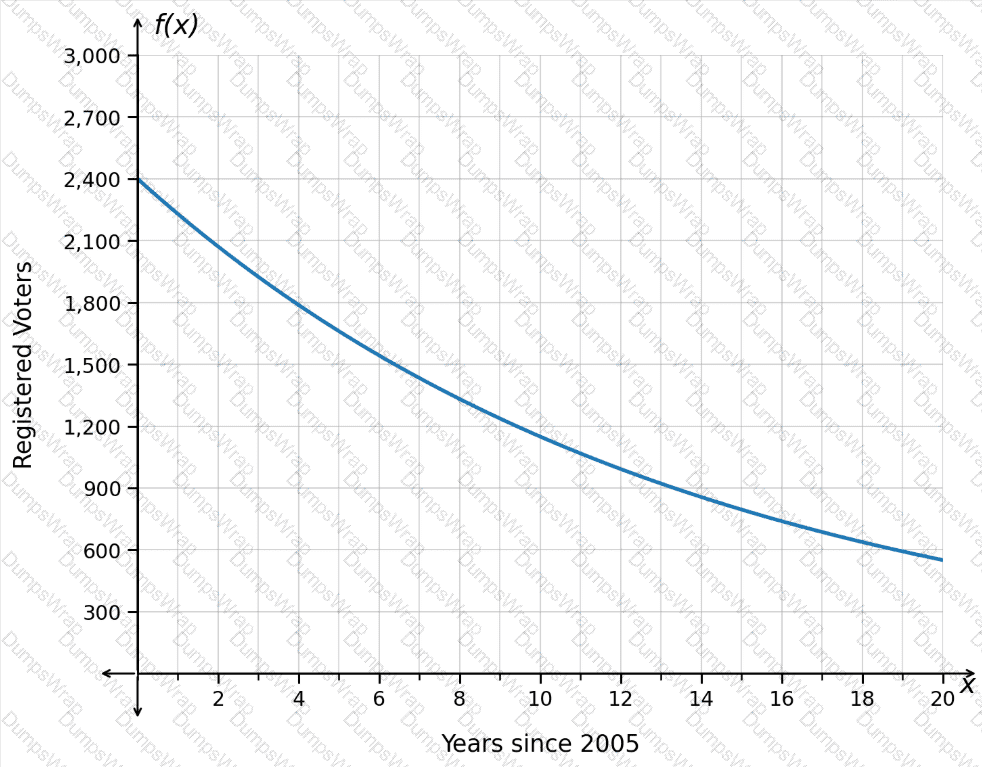
Which interval is associated with the slowest average decrease in the number of registered voters?
The number of people auditioning for a game show is expected to be 3 less than the number of people who auditioned last year. The function A(t)can be used to model the situation, where trepresents the number of people who auditioned last year and Arepresents the number of people expected to audition this year.
Which quantity represents the number of people expected to audition this year, given that 280 people auditioned last year?
The function P(t)represents the weekly profit, in thousands of dollars, for a rental store since opening. The graph of P(t)is shown.
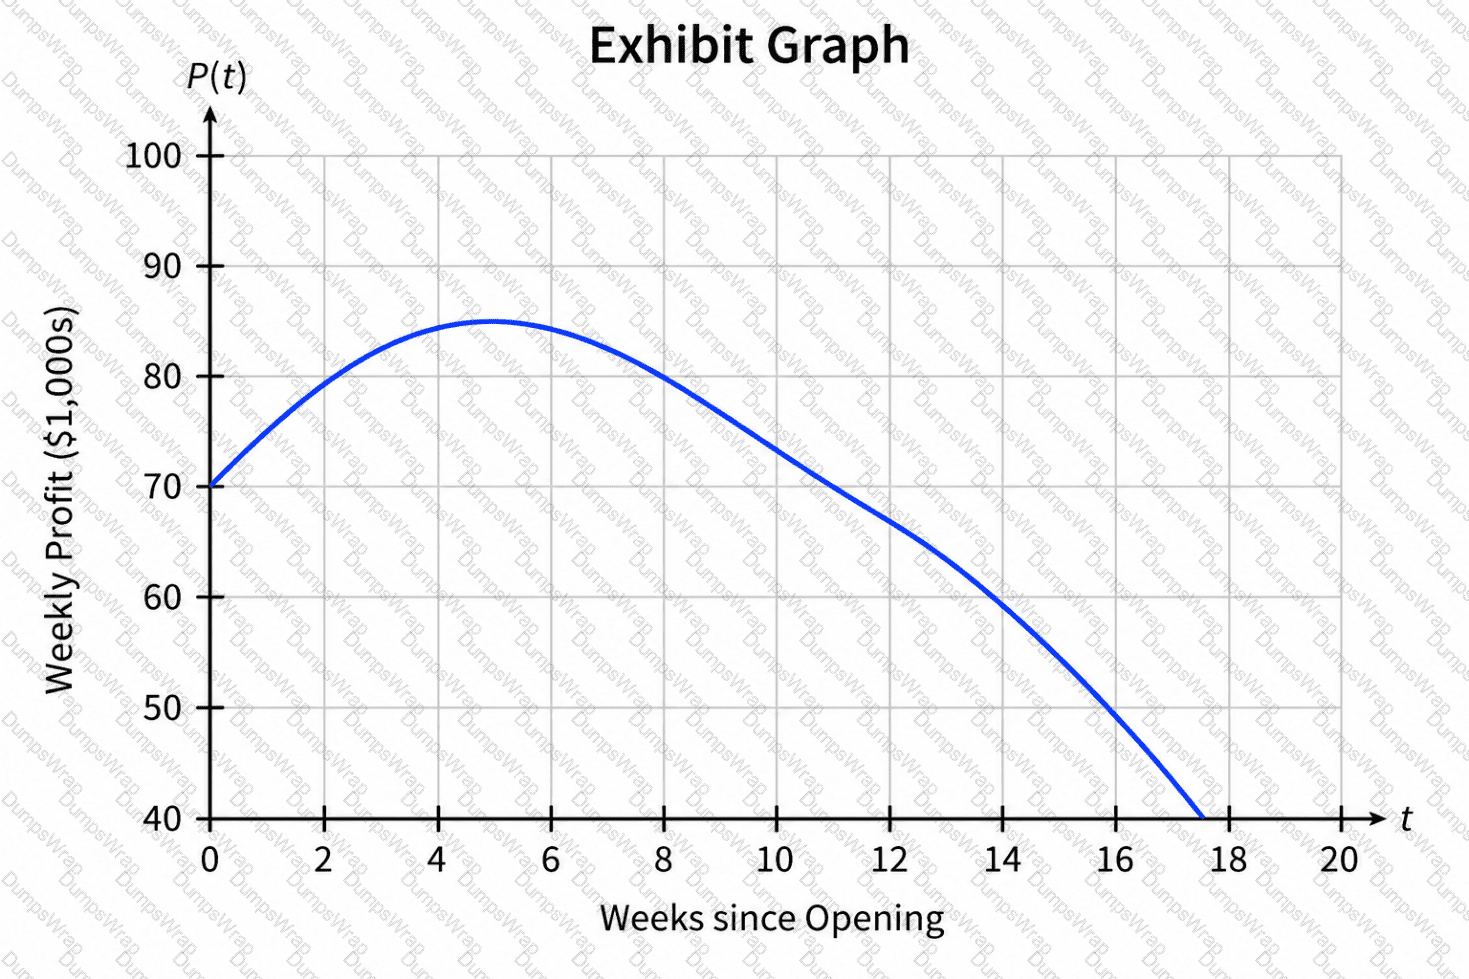
When did the store have its maximum weekly profit?
The populations, in thousands, of two towns are shown in the graph, where the horizontal axis measures the time in years.
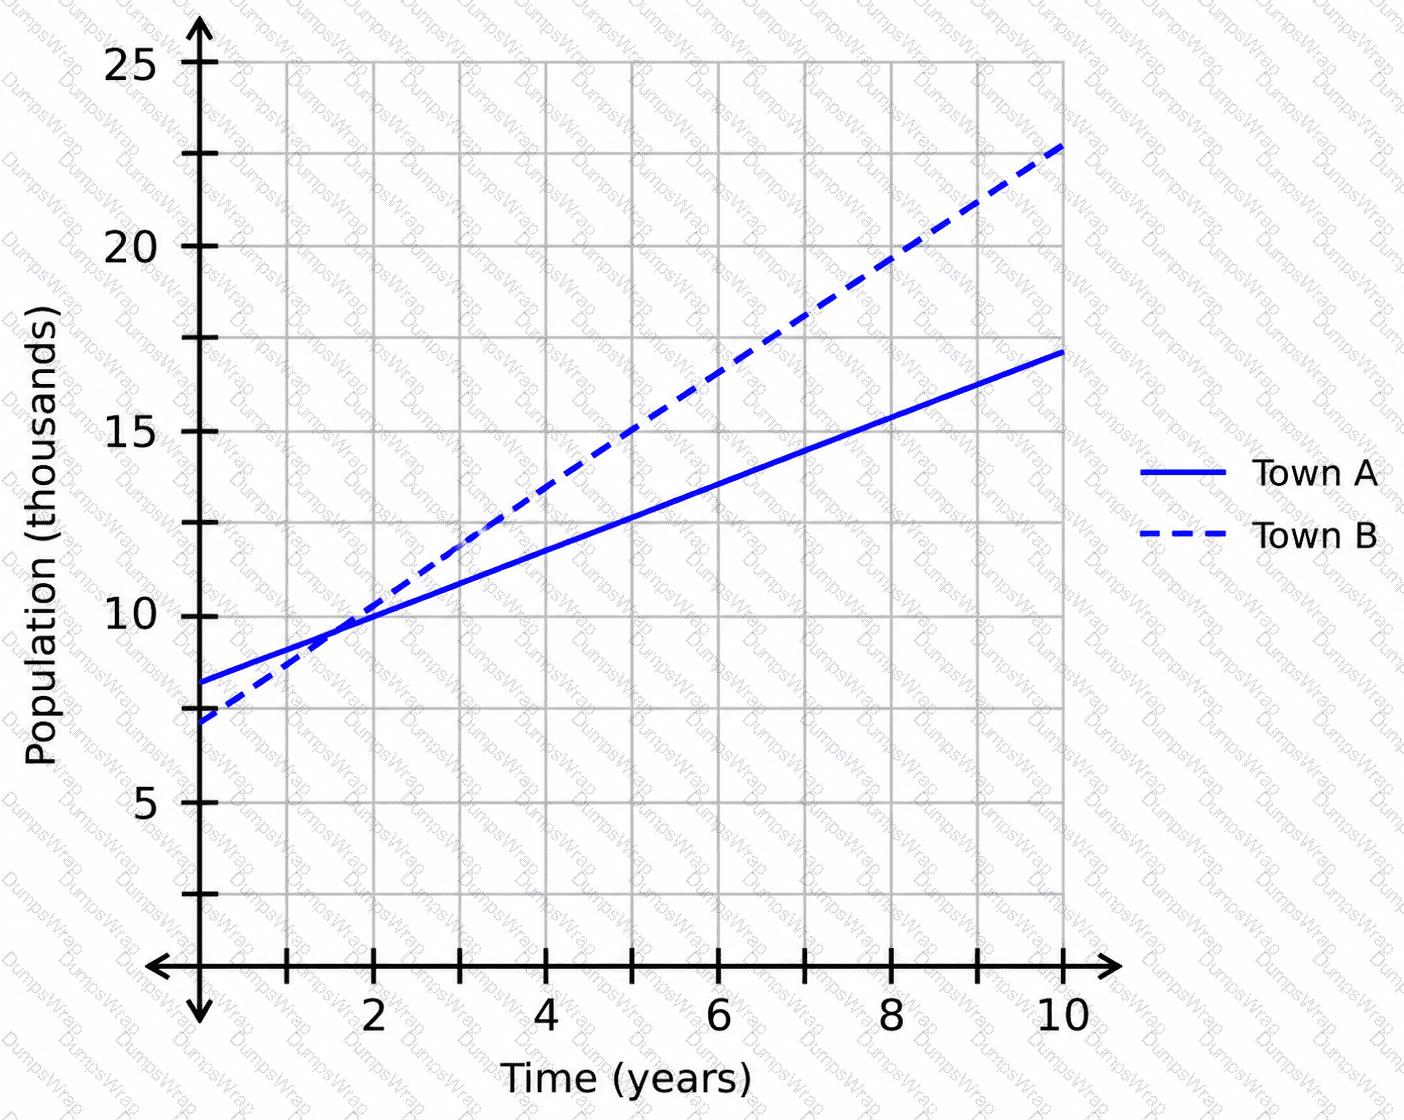
Which town’s population is growing at a faster rate?
The function d(x)=14+65xrepresents the distance, in meters, from a tower to an object at time x, in seconds.
What is the value of d(1.5)?
The graphed function v(t) represents the number of vehicles, v, stopped at a toll booth t hours after 6:00 a.m. The coordinates of points A and B are (1,49.4) and (4,45.8), respectively.
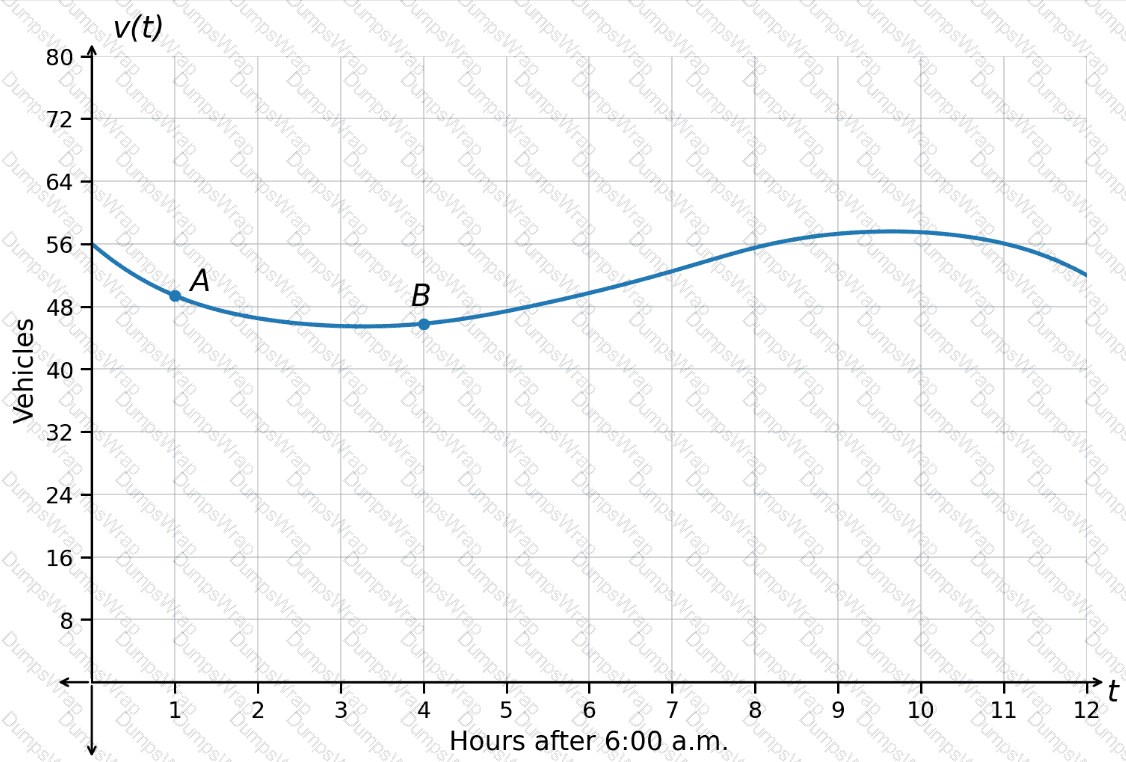
What is the average rate of change of the number of vehicles from point A to point B?