CrowdStrike Certified Falcon Hunter Questions and Answers
You suspect that a user is abusing their admin privileges and you want to see the recent commands they have been utilizing. Which Investigate search will identify this?
Options:
Host Search
Process timeline
User Search
Process Context
Answer:
CExplanation:
The Falcon platform provides specialized Search and Investigation Tools tailored to different forensic starting points. When the pivot point of an investigation is a specific person or account rather than a file or a machine, the User Search dashboard is the most effective tool. While a Host Search would show everything happening on a specific computer (which might include activity from multiple users or system services), the User Search aggregates all activity associated with a specific Username across the entire environment.
By entering the suspect's username into this dashboard, a hunter can view a comprehensive list of all processes, command-line arguments, and network connections initiated under that user’s credentials, regardless of which endpoint they logged into. This is particularly useful for identifying "Insider Threats" or "Privilege Abuse," where an admin might be using net.exe to modify groups or psexec.exe to move laterally. The User Search provides a chronological view of that user's actions, making it easy to spot unauthorized administrative behavior that deviates from their standard job duties. Once a suspicious command is found in the User Search, the analyst can then pivot to the Process Timeline or Process Context for deeper technical inspection of that specific execution.
What can a hunter add at the end of a search string in Advanced Event Search to identify outliers when quantifying the results?
Options:
| groupBy()
| eval()
| sample()
| stats()
Answer:
DExplanation:
In the realm of Hunting Analytics , the ability to quantify data is the first step toward identifying outliers—the "needles in the haystack." The stats() function in Advanced Event Search (LogScale) is the most versatile tool for this purpose. While groupBy() is used to organize data into buckets, stats() is required to perform mathematical aggregations such as count(), sum(), avg(), or stdDev().
To identify outliers, a hunter typically wants to see which events occur with the lowest frequency (Least-Frequency Analysis) or which values deviate significantly from the mean. By appending | stats(count(), function=[...]) to a query, the analyst transforms raw event logs into a statistical summary. For example, a hunter might use stats() to count the number of unique external IP connections per process; a process that normally connects to one IP but suddenly c onnects to 500 would stand out as a clear outlier. This quantification is what allows a hunter to move from "searching" to "analyzing." While eval() is used for calculating new fields and sample() is used for performance testing on large datasets, stats() provides the numerical foundation necessary for sophisticated behavioral baselining and the detection of anomalous activity that doesn't trigger standard signature-based alerts.
==========
Refer to the image.
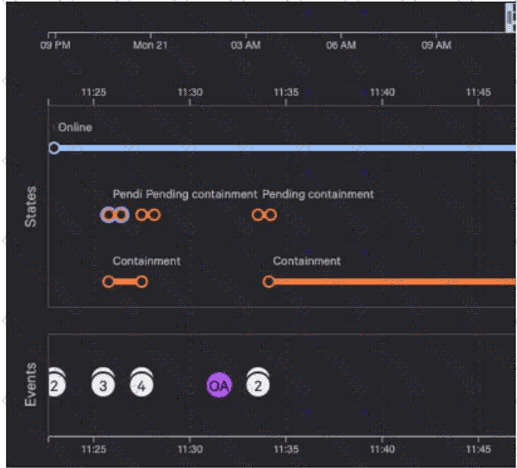
Why are there six pending containment events?
Options:
When requesting containment of a device, there is one event to contain the host by Agent ID and another event to contain by Mac Address
When requesting containment of a device, there is one event for checking of the current host state and another corresponding to the change request
When requesting containment of a device, there is one event to contain the host by Agent ID and another event to contain by Host Name
When requesting containment of a device, there is one event for the change request and another corresponding to the completed status of the request
Answer:
BExplanation:
In the Falcon platform's Host Investigate dashboard, the "States" timeline provides a granular visual history of administrative and system-level transitions for an endpoint. When a network containment action is initiated, the platform must track the lifecycle of that request from the console to the sensor. According to Falcon documentation, for every containment request made by an analyst, the system generates two specific sub-events that are tracked in the "Pending containment" row.
The first event involves the cloud's process of checking the current host state to verify the baseline connectivity and sensor status. The second event corresponds to the actual change request , which is the command sent to the Falcon sensor to apply the network isolation filters (blocking all traffic except for communication with the CrowdStrike cloud).
As seen in the provided image, there are three distinct "bundles" or attempts of containment activity shown. Because each of these three attempts is comprised of these two mandatory sub-events (the check and the request), the timeline displays a total of six icons . This level of detail allows a hunter to troubleshoot containment issues; for instance, if the check event succeeds but the change request remains pending, it could indicate a communication lag or a tamper-protection mechanism on the endpoint. Once the sensor successfully applies the isolation and sends an acknowledgment back to the cloud, the state transitions from "Pending" to the solid "Containment" line seen lower in the timeline.
Refer to the image. Which query will show file execution from a suspicious directory across all hosts?
Options:
#event_simpleName=ProcessRollup2 | aid=* | ImageFileName=/\\Users\\[^\\]+\\Desktop\\/i | groupBy(aid, function=collect([SHA256HashData, ImageFileName] ), limit-max)
#event_simpleName=ProcessRollup2 | aid=c28082797f7f4d81b3f869dbaf6eb712 | ImageFileName=/\$Recycle\.Bin/i | groupBy(aid, function=collect([SHA256HashData, ImageFileName]), limit-max)
#event_simpleName=ProcessRollup2 | aid=* | ImageFileName=/\$Recycle\.Bin/i | groupBy(aid, function=collect([SHA256HashData, ImageFileName]), limit-max)
#event_simpleName=ProcessRollup2 | aid=* | ImageFileName=/\\Users\\[^\\]+\\Downloads\\/i | groupBy(aid, function=collect([SHA256HashData, ImageFileName] ), limit-max)
Answer:
CExplanation:
In the discipline of Hunting Methodology , identifying "hidden in plain sight" directories is a primary objective for uncovering persistent threats. The Recycle Bin ($Recycle.Bin) is considered a highly suspicious directory for process execution because legitimate applications are almost never designed to run from this location. Adversaries frequently utilize this path to stage malicious binaries, as it is a directory that is often overlooked by manual administrative review and some legacy security tools (MITRE ATT & CK T1564.001 - Hidden Files and Directories).
The query in Option C correctly addresses the two specific requirements of the prompt. First, it uses the wildcard aid=* to ensure the hunt is performed across all hosts in the enterprise, providing a global view rather than focusing on a single machine (as seen in Option B). Second, it utilizes a regular expression /\$Recycle\.Bin/i to filter for any ProcessRollup2 events where the ImageFileName originates from the Recycle Bin. While directories like "Downloads" or "Desktop" can also be used for staging, they are significantly "noisier" in a production environment as legitimate users frequently run installers from those paths. By targeting the Recycle Bin and using the groupBy function to aggregate the SHA256HashData, a hunter can quickly identify unique, unauthorized binaries that have been moved to a hidden area to evade detection. This proactive approach allows the security team to identify the "Patient Zero" host and any subsequent lateral movement involving the same malicious hash.
Refer to the image.
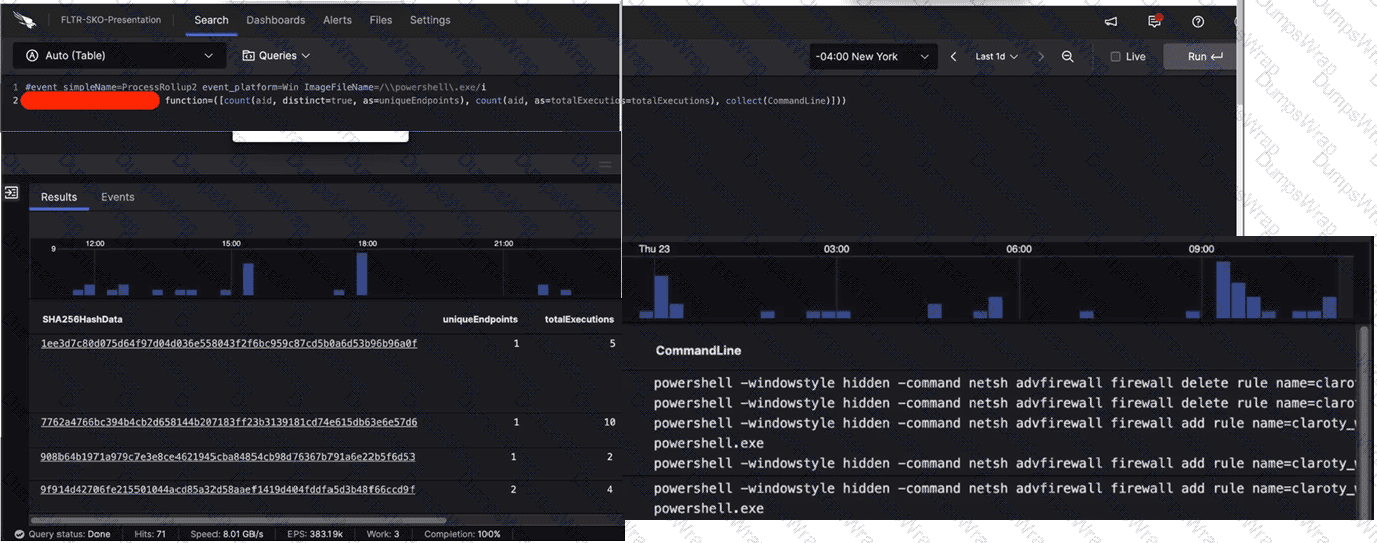
What aggregate function in the CrowdStrike Query Language (CQL) was used to provide the filtered results?
Options:
eval
groupBy
table
stats
Answer:
BExplanation:
In the CrowdStrike Query Language (CQL) used within the LogScale-powered Advanced Event Search, the groupBy() function is the essential tool for data aggregation and summarization. As observed in the first image, Line 2 of the query (partially obscured) utilizes the function= parameter to define multiple aggregate calculations, such as count(aid, distinct=true) and count(aid). This syntax is the hallmark of a groupBy statement.
The results shown in the subsequent images display a table where each row is unique to a specific SHA256HashData . This indicates that the data has been grouped by that specific field to provide a summary of its activity across the environment. The groupBy function allows a hunter to take millions of individual process events and collapse them into a readable format that highlights uniqueEndpoints and totalExecutions per file hash.
This methodology is fundamental to Hunting Analytics , specifically for performing Least Frequency Analysis . By grouping by the hash and counting the unique endpoints, an analyst can quickly identify binaries that are running on only one or two systems—a common characteristic of targeted malware or custom hacking tools. While functions like table (Option C) are used to format the final display and eval (Option A) is used for field transformations, only groupBy provides the structural aggregation required to generate the multi-column statistical overview seen in the results.
You've been tasked with writing a query that would rename the RemoteAddressIP4 field to SourceIP. What would be the correct syntax using the rename() function?
Options:
| rename(RemoteAddressIP=SourceIP)
| rename(RemoteAddressIP4, as=SourceIP)
| rename(RemoteAddressIP4 > > SourceIP)
| rename(RemoteAddressIP4 := SourceIP)
Answer:
BExplanation:
In the CrowdStrike Query Language (CQL) , data transformation is a key step in creating readable and actionable reports. The rename() function is used to change the field names in the output of a query, which is especially useful when normalizing data for external stakeholders or preparing a dataset for a World Map or Table widget. The standard and required syntax for this operation in the LogScale/Falcon environment is | rename(originalFieldName, as=newFieldName).
Using the as= parameter is explicit and ensures that the query engine correctly maps the telemetry from the sensor (such as RemoteAddressIP4) to the desired descriptive name (like SourceIP). This is a common practice in Event Search when combining data from different sources where field names might not align—for example, joining Falcon host data with firewall logs. Option A is syntactically incorrect because it uses an equals sign without the "as" parameter. Options C and D use operators ( > > or :=) that are not recognized by the CQL rename function. Mastering these syntax nuances is essential for any hunter who wants to create professional, clean Reports and References that can be easily understood by other security analysts or integrated into broader organizational dashboards.
Which document can reference any searchable event and its description?
Options:
Events Index
Query Builder
Advanced Event Search
Events Full Reference (Events Data Dictionary)
Answer:
DExplanation:
In the CrowdStrike Falcon ecosystem, the Events Full Reference , commonly referred to as the Events Data Dictionary , is the foundational documentation for any analyst performing raw telemetry analysis. This document serves as the definitive encyclopedia for every event type (such as ProcessRollup2, NetworkConnectIP4, or DnsRequest) and every individual field (such as aid, TargetProcessId, or CommandLine) captured by the Falcon sensor.
When a hunter is crafting complex queries in Event Search , the Data Dictionary provides the necessary context to understand exactly what a specific field represents and the data types it contains. For example, if an analyst is unsure whether a timestamp is in milliseconds or seconds, or needs to know the difference between a ParentProcessId and a ContextProcessId, the Events Full Reference is the primary source of truth. Utilizing this document is a core part of the Hunting Methodology , as it allows the hunter to move beyond the high-level GUI and build precise, technical queries based on a deep understanding of the underlying data structure. Without referencing this data dictionary, an analyst might misinterpret field values, leading to "false negatives" in their search results. It is the essential roadmap for navigating the massive amounts of telemetry stored within the Falcon platform.
What will the following obfuscated command do?
cmd /c "set x=^n^e^t & set y=@er & set yy=z & set z=r & set r=remove & set f=Domain+ff & set ff=Admin & set g=gumball@ & echo %x%%y:@=us% /%z:r=add% %ff% %g:@=r% | cmd"
Options:
Add a user named “Admin” to the local host
Remove a user named “Admin” from the local host
Change the password for a user named “Admin” to “%g:@=r%”
Add a user named “Admin” to the Domain Admins group
Answer:
AExplanation:
Comprehensive and Detailed 150 to 250 words of Explanation From Falcon Hunter Topics documents:
When this command is deobfuscated, it resolves to the Windows command:
net user /add Admin gumballr
That means the command is creating a local user account named Admin and assigning it a password. The obfuscation works by defining environment variables and then using substring replacement during expansion. x=^n^e^t becomes net, y=@er becomes user after replacing @ with us, z=r becomes add after replacing r with add, ff=Admin provides the username, and g=gumball@ becomes gumballr after replacing @ with r. The final echoed command is piped into cmd, which executes it.
Because the command uses net user /add , the correct outcome is adding a user account, not removing one, not changing a password, and not adding the account to the Domain Admins group. No net localgroup or net group command is present, which would be required for group membership changes. This makes A the only correct answer. The behavioral analysis aligns with Falcon Hunter-style command-line review, but the verification here is from the command syntax itself rather than a located official Hunter quiz page.
While performing a hunt for unusual PowerShell commands, you discover the following command being run on a single host:
powershell.exe "(New-Object
The process tree for this command looks like this:
winlogon.exe > userinit.exe > explorer.exe > powershell_ise.exe > powershell.exe All of the commands are run during normal working hours under the account of a user from the IT department. What should be your next steps in the investigation?
Options:
Start an RTR (Real Time Response) session on the host. Check the user's Downloads folder for the file AppPathBypass.ps1 and analyze the file for malicious content.
Mark the detection as True Positive. Trigger an automated remediation to remove all malicious files and methods of persistence.
Mark the detection as a False Positive because nothing happened on the host.
Perform a +/- 10-minute search for events around this process execution to get more context. Contact the user to confirm whether or not this was testing-related activity.
Answer:
DExplanation:
In proactive Hunting Methodology , the context of an execution is just as critical as the command itself. The provided process tree (winlogon - > userinit - > explorer - > powershell_ise) indicates a standard interactive user session where the user manually opened the PowerShell ISE. Because the account belongs to the IT department and the activity occurred during normal working hours , there is a high probability that this is authorized administrative testing or troubleshooting.
Jumping straight to an RTR session or marking the event as a True Positive without investigation could lead to unnecessary business disruption. Conversely, marking it as a False Positive immediately is dangerous, as attackers often "live off the land" using IT credentials. The correct Hunter approach is to expand the investigation window—typically a +/- 10-minute search —to see what happened immediately before and after the command. This helps determine if the script was part of a larger, unexplained chain of events. Contacting the user to verify the activity is a standard "sanitized" inquiry in a professional environment. If the user confirms they were testing a bypass for a legitimate deployment, the event can be tuned. If they deny knowledge, the investigation escalates to a full incident response. This balance of technical telemetry and human verification is a core tenant of the Falcon Hunter's workflow.
Which hunting query's results could indicate that an adversary is performing reconnaissance from a specific host?
Options:
#event_simpleName=ProcessRollup2 | aid=?aid | ImageFileName=/ (? < FileName > [^\\\/]*)$ / | FileName=/^(explorer|lsass|svchost|smss|winlogon|userinit)\.exe$/i | table([aid, UserName, ParentBaseFileName, ImageFileName, CommandLine] , limit=1000)
#event_simpleName=NetworkScanEvent | aid=?aid | !cidr(RemoteAddressIP4, subnet=["224.0.0.0/4", "10.0.0.0/8", "172.16.0.0/12", "192.168.0.0/16", "127.0.0.0/8", "169.254.0.0/16", "0.0.0.0/32"]) | table([aid, UserName, ParentBaseFileName, ImageFileName, CommandLine] , limit=1000)
#event_simpleName=NetworkConnect* | RemotePort=?RemotePort aid=?aid | !cidr(RemoteAddressIP4, subnet=["224.0.0.0/4", "10.0.0.0/8", "172.16.0.0/12", "192.168.0.0/16", "127.0.0.0/8", "169.254.0.0/16", "0.0.0.0/32"]) | table([aid, LocalAddressIP4, LocalPort, RemoteAddressIP4, RemotePort] , limit=1000)
#event_simpleName=ProcessRollup2 | aid=?aid | ImageFileName=/ (? < FileName > [^\\\/]*)$ / | FileName=/^(net|ipconfig|whoami|quser|ping|netstat|tasklist|hostname|at)\.exe$/i | table([aid, UserName, ParentBaseFileName, ImageFileName, CommandLine] , limit=1000)
Answer:
DExplanation:
In the context of Hunting Methodology , reconnaissance (often categorized under the Discovery tactic in the MITRE ATT & CK framework) involves an adversary gathering information about the internal network, host configurations, and user privileges. The query in Option D is specifically designed to hunt for this behavior by monitoring the execution of "Living off the Land" (LotL) binaries.
These built-in Windows utilities, while legitimate for administrative use, are the primary tools used by attackers to "get the lay of the land." Commands like whoami are used for System Owner/User Discovery (T1033), ipconfig and netstat for System Network Configuration Discovery (T1016), and tasklist for Process Discovery (T1057). By filtering for these specific filenames—net, ipconfig, whoami, quser, ping, netstat, tasklist, hostname, and at—on a specific host (aid), a hunter can identify a burst of discovery activity. While individual executions might be common, a series of these commands run in rapid succession by a non-administrative user is a high-confidence indicator of a compromise. This proactive search allows analysts to catch an adversary in the early stages of an attack, before they have successfully identified their next target for lateral movement or privilege escalation.
You suspect one of your endpoint host systems may have a vulnerable BIOS version. Which Investigate Dashboard will confirm vulnerability information such as the type and timeline?
Options:
BIOS Prevalence
BIOS Analysis
BIOS Search
BIOS Firmware Inventory
Answer:
BExplanation:
In the context of Search and Investigation Tools , the BIOS Analysis dashboard is a specialized forensic resource that provides deep visibility into the firmware health of the managed fleet. While "BIOS Firmware Inventory" (Option D) provides a flat list of current versions across the organization, the BIOS Analysis dashboard is uniquely designed to correlate that inventory data with known vulnerabilities and historical change events.
For a hunter, this dashboard is essential for identifying systems at risk of hardware-level persistence or "Bootkit" attacks. It provides a detailed timeline of firmware updates and changes, allowing an investigator to see exactly when a BIOS version was modified—which is critical if an adversary has attempted to flash a malicious or vulnerable firmware image. Furthermore, the dashboard categorizes vulnerabilities by type and severity, mapping them to specific CVEs (Common Vulnerabilities and Exposures). This level of detail allows security teams to prioritize patching for the most critical assets first. By moving beyond simple inventory and into behavioral and vulnerability analysis of the BIOS, the Falcon platform enables hunters to address threats that exist below the operating system level, ensuring a comprehensive security posture that extends from the hardware to the cloud.
Refer to the image.
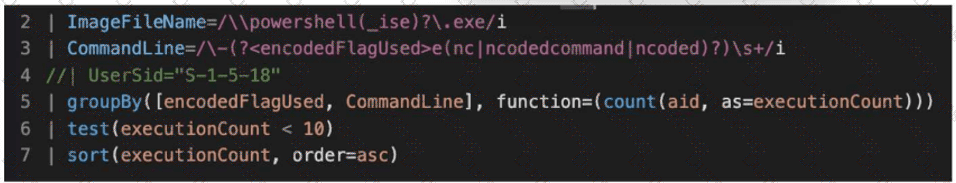
What line item of the query is used to perform outlier analysis?
Options:
Line 6
Line 3
Line 4
Line 7
Answer:
AExplanation:
In the context of Hunting Analytics , outlier analysis—often referred to as Least Frequency Analysis (LFA) or "Long-Tail Analysis"—is a methodology used to identify anomalous behavior by isolating events that occur rarely within a large dataset. Attackers often use unique command-line arguments or rare scripts that stand out when compared to the repetitive, high-volume "noise" generated by standard administrative activities or automated system processes.
In the provided CrowdStrike Query Language (CQL) query, Line 6 (| test(executionCount < 10)) is the specific line used to perform this outlier analysis. While Line 5 performs the aggregation and counting of events across the environment, it is Line 6 that applies a logic threshold to filter out common events. By instructing the engine to only return results where the executionCount is less than 10, the hunter is intentionally discarding all "normal" high-frequency activity and focusing exclusively on rare executions. This is a critical step in a PowerShell hunt, as most legitimate enterprise scripts will run hundreds or thousands of times, whereas a malicious manual execution or a new, untested exploit script will typically have a very low execution count. Line 7 further assists by sorting these outliers in ascending order, but the actual analytical "test" that defines the outlier occurs in Line 6. Utilizing such thresholds allows hunters to efficiently sift through millions of events to find the "needles in the haystack" that represent potential security breaches.
Your organization has identified a malicious Scheduled task that executes every 5 minutes. Which LogScale event search function can be used to quickly identify and display the unique hosts affected by the malware?
Options:
stats
table()
groupBy()
uniq
Answer:
CExplanation:
When dealing with widespread malware, such as a persistent scheduled task, a hunter must be able to aggregate vast amounts of telemetry into a manageable list of impacted assets. Within the CrowdStrike Query Language (CQL) used in LogScale, the groupBy() function is the primary tool for data aggregation and deduplication. While functions like table() simply format the output and stats is often used for mathematical calculations, groupBy() allows the analyst to collapse thousands of individual "ServiceStarted" or "ScheduledTaskRegistered" events into a distinct list based on a specific field, such as aid (Agent ID) or ComputerName.
For this specific scenario, a hunter would query for the specific task name or the command-line arguments associated with the 5-minute execution interval and then pipe those results into | groupBy([aid]). This effectively filters out the noise of repeated executions from the same machine, presenting the hunter with a clear, unique count of every host that has been compromised. This efficiency is vital during the "Scope" phase of an investigation. By utilizing groupBy(), an analyst can quickly determine if the infection is localized to a single department or has spread globally across the enterprise, allowing for a prioritized remediation strategy using Bulk RTR or other containment measures.
You've experienced a ransomware infection that has spread throughout the enterprise. What is the first step you would take to determine the source of infection?
Options:
Perform a PowerShell hunt to look for suspicious PowerShell commands
Use Advanced Event Search to timeline encryption activity and determine the system with the first encryption event
Utilize Exposure Management to identify systems with critical vulnerabilities that could be exploited
Perform reverse engineering on the malware sample to see if you can find the infection vector
Answer:
BExplanation:
In the event of a widespread ransomware outbreak, the primary objective of the Hunting Methodology shifts toward identifying "Patient Zero"—the first system compromised in the environment. While reverse engineering (Option D) and vulnerability management (Option C) provide long-term value, they do not offer the immediate forensic clarity needed to stop an active spread or identify the entry point. By utilizing Advanced Event Search to create a chronological timeline of file encryption events (typically identified by high-frequency fswrite operations or specific ransom note creation), a hunter can pinpoint the exact timestamp and host where the activity originated.
This process involves searching for the earliest instances of the ransomware's execution or the first signs of large-scale file modifications across the entire fleet. Once the first system is identified, the analyst can then pivot to look for the activity that occurred prior to the encryption, such as a suspicious email attachment execution, a web-based exploit, or a compromised RDP session. This "backwards-looking" investigation is essential for determining the initial delivery mechanism. Identifying the source host allows the security team to isolate the breach at its root, invalidate compromised credentials used for the initial access, and ensure that remediation efforts are not just treating the symptoms (the encrypted files) but addressing the actual cause of the enterprise-wide infection.
You want to hunt for the least-used Windows services that are starting from non-standard locations. Which query below will provide this information?
Options:
#event_simpleName=ServiceStarted ImageFileName!=/(\\servicing\\|\\SysWOW64\\)/i | groupBy([ServiceDisplayName], function=[collect([ImageFileName] ), count(as=count)], l imit=20000) | sort(field=count, limit=20000, order=asc)
#event_simpleName=ServiceStarted ImageFileName!=/(\\servicing\\|\\Services\\)/i | groupBy([ServiceDisplayName], function=[collect([ImageFileName] ), count(as=count)], limit=20000) | sort(field=count, limit=20000, order=asc)
#event_simpleName=ServiceStarted ImageFileName!=/(\\servicing\\|\\System32\\)/i | groupBy([ServiceDisplayName], function=[collect([ImageFileName] ), count(as=count)], limit=20000) | sort(field=count, limit=20000, order=asc)
#event_simpleName=ServiceStarted ImageFileName=/(\\System32\\)/i | groupBy([ServiceDisplayName], function=[collect([ImageFileName] ), count(as=count)], limit=20000) | sort(field=count, limit=20000, order=asc)
Answer:
CExplanation:
In proactive threat hunting, Least-Frequency Analysis (LFA) is a powerful technique used to identify anomalies by looking for rare events that deviate from the organizational baseline. Windows services typically execute from standardized, protected directories such as C:\Windows\System32\. When a service is observed starting from a non-standard location—such as a user's Temp folder or a suspicious application directory—it often indicates persistence or a "Living off the Land" attack.
The correct query utilizes the != (not equal) operator within the CrowdStrike Query Language (CQL) to filter out legitimate, common paths. By excluding the System32 and servicing directories, the hunter narrows the dataset to focus exclusively on services running from irregular paths. The groupBy function is then used to aggregate these occurrences by ServiceDisplayName, collecting the specific ImageFileName and counting the frequency of each. Finally, sorting by count in ascending order (order=asc) ensures that the "least-used" or rarest services appear at the top of the results. This methodology allows a hunter to bypass the "noise" of thousands of standard system services and pinpoint unique, potentially malicious binaries that have registered themselves as services to maintain a long-term foothold on the endpoint.
==========
What is the purpose of this query?
#event_simpleName=UserLogon LogonType=10 RemoteAddressIP4=* | !cidr(RemoteAddressIP4, subnet=["224.0.0.0/4", "10.0.0.0/8", "172.16.0.0/12", "192.168.0.0/16", "127.0.0.0/8", "169.254.0.0/16", "0.0.0.0/32"]) | ipLocation(RemoteAddressIP4) | worldMap(ip=RemoteAddressIP4, magnitude=count(aid))
Options:
Display all locations for local subnets on a map
Display all users who are logging in from private IP ranges on a map
Display geolocation data for all network logins on a map
Display geolocation data for RDP connections on a map
Answer:
DExplanation:
This query is a sophisticated example of using Event Search to visualize potential external threats. The key to identifying the purpose lies in the LogonType=10 filter. In Windows event logging, Logon Type 10 specifically refers to Remote Interactive logons, which are almost exclusively associated with Remote Desktop Protocol (RDP) sessions. By combining this with RemoteAddressIP4=*, the hunter is isolating instances where a user has accessed a system remotely.
The query then utilizes the !cidr function (the exclamation mark denotes a "NOT" operation) to exclude all internal and private IP ranges defined by RFC 1918 (such as 10.x.x.x and 192.168.x.x) as well as loopback and multicast addresses. This ensures that the resulting dataset only contains logons originating from external/public IP addresses . The ipLocation function enriches these external IPs with geographic metadata (city, country, coordinates), and the worldMap function aggregates this data to plot the origin of these RDP connections onto a global map. For a hunter, this is a vital tool for detecting "Impossible Travel" scenarios or identifying unauthorized access attempts from high-risk geographic regions. Visualizing the magnitude of connections per aid (Agent ID) allows the analyst to quickly spot which specific endpoints are being targeted by external RDP brute-force or credential stuffing attacks.
Which Investigate tool will show you which users have logged in to a particular server?
Options:
Search by agent ID
Host search
User Search
Bulk domains
Answer:
BExplanation:
The Host search (often accessed via the Host Investigate dashboard) is the primary "Host-Centric" investigation tool in the Falcon console. When an analyst enters a hostname or Agent ID (AID) into this tool, Falcon retrieves a consolidated view of that specific system's activity. One of the most critical sections of this dashboard is the Recent Logons list.
This view provides a chronological history of every user account—both local and domain—that has successfully authenticated to the host. For a hunter, this is an essential part of the Hunting Methodology for identifying "Credential Overlap" or unauthorized access. If an unusual administrative account or a service account that has no business being on that server is listed, it can indicate lateral movement (T1021). While User Search (Option C) allows you to see all the machines a specific user has touched, only Host search provides the "reverse" view: every user that has touched a specific machine . This allows the analyst to establish a baseline of "normal" users for a server (e.g., specific DBA accounts for a SQL server) and quickly spot anomalies that warrant a deeper dive into the UserLogon events in the Event Search.
Falcon is generating detections for a malicious file evil.exe with varying filepaths on several hosts as end users attempt to execute the file. Which query can be used to proactively hunt where the file exists prior to the user executing it?
Options:
#event_simpleName=ProcessRollup2 OR #event_simpleName=SyntheticProcessRollup2 | ImageFileName=/evil.exe/i | ImageFileName=/([\/\\])(? < FileName > \w*\.?\w*)$/ | stats count by aid, hostname, FileName, ImageFileName, CommandLine
#event_simpleName=ProcessRollup2 OR #event_simpleName=SyntheticProcessRollup2 | aid=?aid | ImageFilePath=/C:\users\/ | ImageFileName=evil.exe | table([aid, hostname, FileName, ImageFileName, CommandLine], limit=1000)
#event_simpleName=ProcessRollup2 OR #event_simpleName=SyntheticProcessRollup2 | aid=?aid | ImageFilePath=C:\users\*\evil.exe | table([aid, hostname, FileName, ImageFileName, CommandLine], limit=1000)
#event_simpleName=ProcessRollup2 OR #event_simpleName=SyntheticProcessRollup2 | ImageFileName=/evil.exe/i | ImageFileName=/([\/\\])(? < FileName > \w*\.?\w*)$/ | table([aid, hostname, FileName, ImageFileName, CommandLine], limit=1000)
Answer:
DExplanation:
To effectively hunt for a malicious file like evil.exe across multiple hosts with "varying filepaths," a hunter must utilize the power of CrowdStrike Query Language (CQL) to aggregate execution telemetry. The inclusion of both ProcessRollup2 and SyntheticProcessRollup2 is vital in this scenario; while ProcessRollup2 captures new executions, SyntheticProcessRollup2 identifies processes that were already active when the Falcon sensor started. This provides critical visibility into files that "existed" and were already operational on the system prior to the detection of a new execution attempt.
The query in Option D is the most effective for a "proactive hunt" because it uses a regular expression—| ImageFileName=/([\/\\])(? < FileName > \w*\.?\w*)$/—to dynamically extract the actual filename into a new field (FileName) from the full path (ImageFileName). This allows the analyst to filter specifically for evil.exe while simultaneously seeing the "varying filepaths" where it resides. By outputting the results into a table containing the aid, hostname, and ImageFileName, the hunter generates a clear list of every unique location and host where the file is present. Unlike a stats count which only provides numerical volume, the table function provides the specific forensic artifacts (the paths) needed to begin remediation or host containment across the entire enterprise. This methodology allows the security team to identify the "blast radius" of the infection and uncover hidden instances of the malware that haven't yet triggered a primary detection.